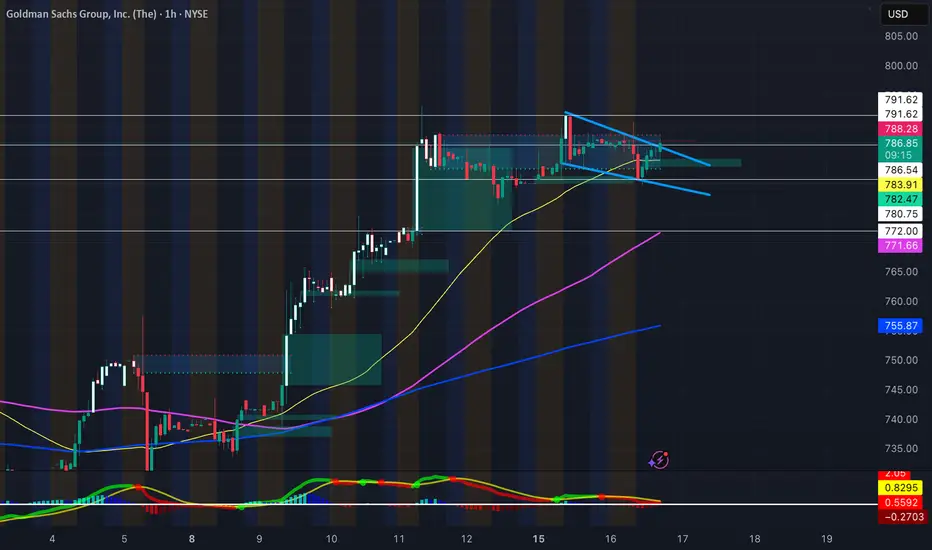
Long GS Falling Wedge FormingFalling wedge forming on NYSE:GS hourly, with NYSE:GS bouncing off its 50-day SMA. It's EMA's are curling upwards, and a bullish FVG formed as support. With pending FOMC conference tomorrow and potential rate cuts, certainly will be watching NYSE:GS
PT1 - 790.40
PT2 - 794.50
PT3 - 798.90
Key facts today
Next report date
—
Report period
—
EPS estimate
—
Revenue estimate
—
46.08 USD
14.28 B USD
126.83 B USD
301.24 M
About Goldman Sachs Group, Inc. (The)
Sector
Industry
CEO
David Michael Solomon
Website
Headquarters
New York
Founded
1869
ISIN
US38144G8042
FIGI
BBG0000092F8
The Goldman Sachs Group, Inc. engages in the provision of financial services. It operates through the following business segments: Global Banking and Markets, Asset and Wealth Management, and Platform Solutions. The Global Banking and Markets segment includes investment banking, global investments, and equity and debt investments. The Asset and Wealth Management segment relates to the direct-to-consumer banking business which includes lending, deposit-taking, and investing. The Platform Solutions segment includes consumer platforms such as partnerships offering credit cards and point-of-sale financing, and transaction banking. The company was founded by Marcus Goldman in 1869 and is headquartered in New York, NY.
Related stocks
The "Gravestone Doji" Is The #1 Chart PatternA long time ago i was talking to a friend
of mine over the phone.
He lives in Australia now.His father
had a high paying job.
Because of that his father
used his resources to help
his first born child
immigrate to a first world country.
This strategy is very common in the
upper middle class
a
Goldman Sachs - Too Cheap to Ignore?NYSE:GS and the general financial services sector as a whole has faced extreme trauma over this past month. However, one that particularly stands out is the "bad guy" of the industry who has taken the equivalent to a roundhouse kick to the face, and the chart shows it. But does this mean that someo

#GS - Aug 2025Date: 16-08-2025
Goldman Sachs - Current Price: 732
Pivot Point: 741 Support: 729 Resistance: 753
Upside Targets:
--------------------------------
| Target | Price |
---------------------------------
| 🎯 Target 1 | 763 |
| 🎯 Target 2 | 774 |
| 🎯 T

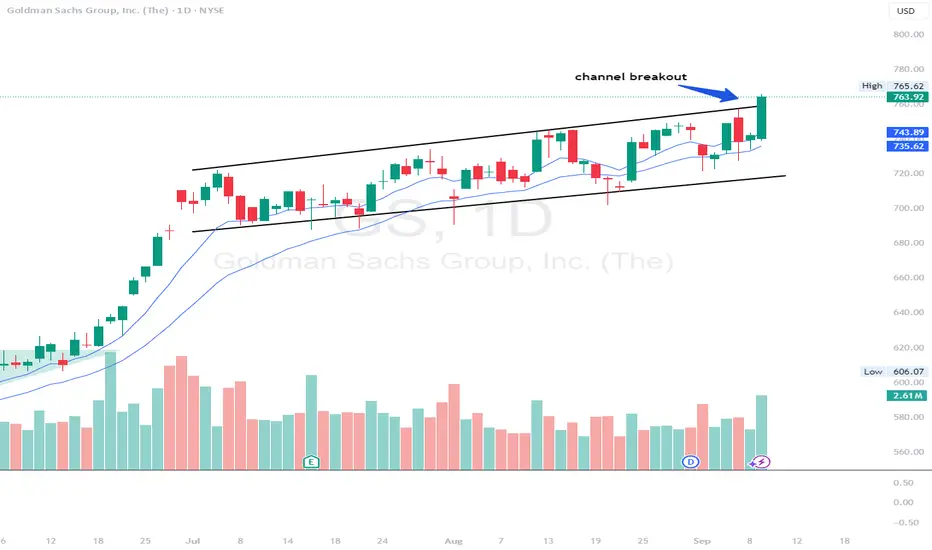
$GS - channel breakout hereGS - Stock breakout out of the channel here after multiple breakout attempts hitting all time highs. banks stock look like they have momentum here. looking for calls above $765 for a move towards $780 and $800. Stock is decent at the indicator level.
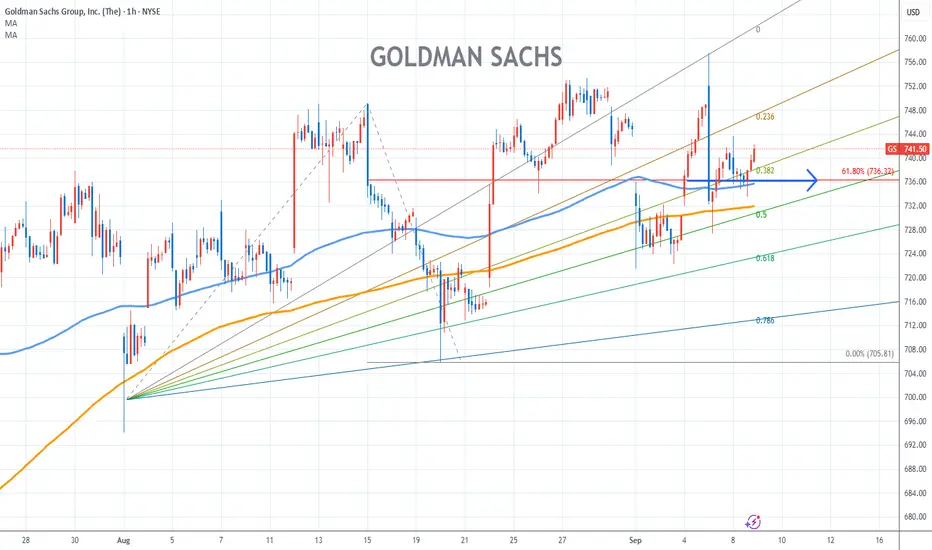
Goldman Sachs Stock Chart Fibonacci Analysis 090825Trading Idea
1) Find a FIBO slingshot
2) Check FIBO 61.80% level
3) Entry Point > 736/61.80%
Chart time frame:C
A) 15 min(1W-3M)
B) 1 hr(3M-6M)
C) 4 hr(6M-1year)
D) 1 day(1-3years)
Stock progress:A
A) Keep rising over 61.80% resistance
B) 61.80% resistance
C) 61.80% support
D) Hit the bottom
E)
Goldman Sachs Group Inc. (NYSE) (W)Breakout Confirmation: Price has successfully broken above the $700–$740 resistance zone with sustained weekly closes, confirming a strong breakout.
Current Price Action: Closed at $741.89 (+1.53%), consolidating just above the breakout level – a healthy sign of strength.
Key Levels:
Support

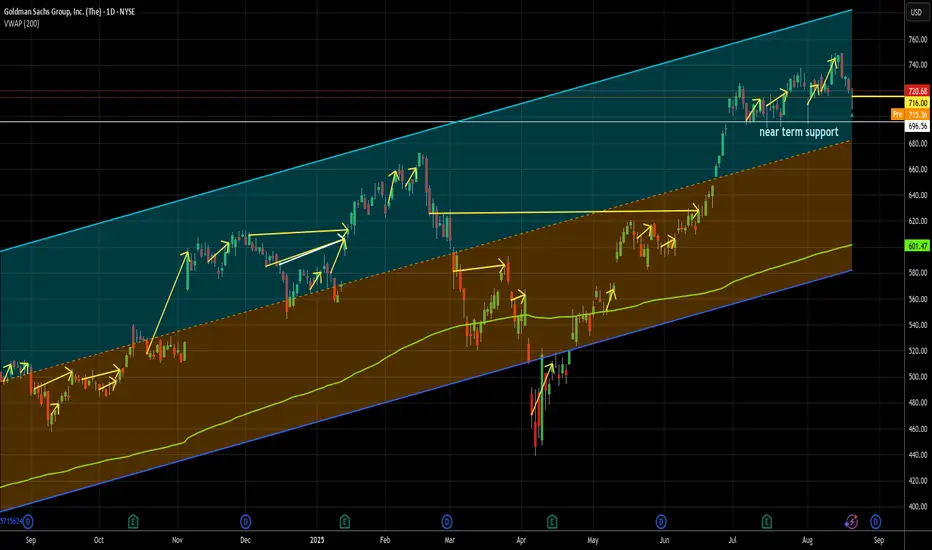
Goldman is a classic in more ways than one - long at 716.00 The 716.00 was a pre-market trade, btw. Goldman benefits whenever the rich benefit, and if there's one thing I'm sure of in the next several years, it's that the rich in America will outperform everyone else financially. But this isn't just a play on macro, government related, targeted largesse. I
Goldman SachsThe stock price of Goldman Sachs is likely to experience a significant drop at the intersection of the trendline and point D of the Crab pattern.

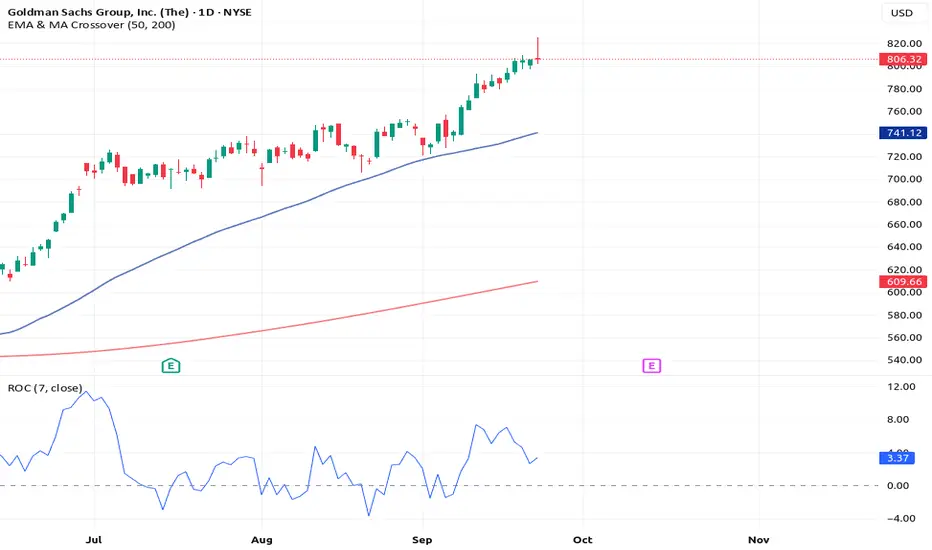
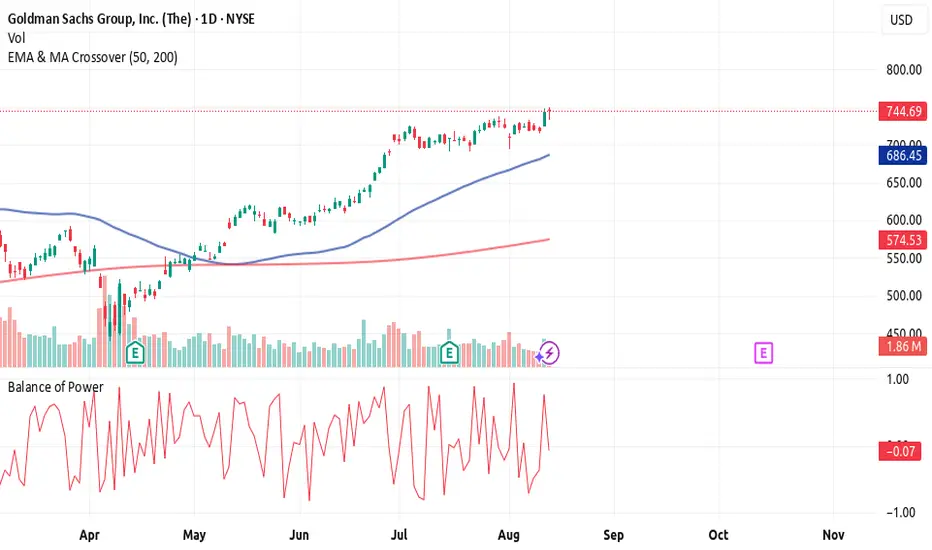
Rocket Booster Setup is Igniting Above the 50 & 200 EMAGoldman Sachs: Rocket Booster Setup is Igniting 🚀
Goldman Sachs NYSE:GS (GS) is showing signs of a potential upside move according to the Rocket Booster Strategy and supporting technical indicators.
Key Bullish Signals
Above the 50 & 200 EMA (Rocket Booster Strategy)
The price is ho
See all ideas
Summarizing what the indicators are suggesting.
Oscillators
Neutral
SellBuy
Strong sellStrong buy
Strong sellSellNeutralBuyStrong buy
Oscillators
Neutral
SellBuy
Strong sellStrong buy
Strong sellSellNeutralBuyStrong buy
Summary
Neutral
SellBuy
Strong sellStrong buy
Strong sellSellNeutralBuyStrong buy
Summary
Neutral
SellBuy
Strong sellStrong buy
Strong sellSellNeutralBuyStrong buy
Summary
Neutral
SellBuy
Strong sellStrong buy
Strong sellSellNeutralBuyStrong buy
Moving Averages
Neutral
SellBuy
Strong sellStrong buy
Strong sellSellNeutralBuyStrong buy
Moving Averages
Neutral
SellBuy
Strong sellStrong buy
Strong sellSellNeutralBuyStrong buy
Displays a symbol's price movements over previous years to identify recurring trends.
FI4000513932
Goldman Sachs International 0.0% 02-AUG-2027Yield to maturity
95.73%
Maturity date
Aug 2, 2027
XS1610659358
Goldman Sachs Group, Inc. 22.799999% 01-DEC-2026Yield to maturity
40.53%
Maturity date
Dec 1, 2026
XS2398659925
Goldman Sachs Group, Inc. 9.95% 08-FEB-2030Yield to maturity
19.89%
Maturity date
Feb 8, 2030
See all GS/PD bonds
XPF
iShares S&P/TSX North American Preferred Stock Index ETF (CAD-Hedged) Trust UnitsWeight
0.47%
Market value
800.22 K
USD
Explore more ETFs
Curated watchlists where GS/PD is featured.


Frequently Asked Questions
The current price of GS/PD is 21.27 USD — it has increased by 0.56% in the past 24 hours. Watch Goldman Sachs Group, Inc. (The) Dep Shs repstg 1/1000 Pfd Ser D Fltg stock price performance more closely on the chart.
Depending on the exchange, the stock ticker may vary. For instance, on NYSE exchange Goldman Sachs Group, Inc. (The) Dep Shs repstg 1/1000 Pfd Ser D Fltg stocks are traded under the ticker GS/PD.
GS/PD stock has risen by 1.47% compared to the previous week, the month change is a 0.23% rise, over the last year Goldman Sachs Group, Inc. (The) Dep Shs repstg 1/1000 Pfd Ser D Fltg has showed a −6.71% decrease.
GS/PD reached its all-time high on Nov 10, 2021 with the price of 29.98 USD, and its all-time low was 4.11 USD and was reached on Sep 16, 2008. View more price dynamics on GS/PD chart.
See other stocks reaching their highest and lowest prices.
See other stocks reaching their highest and lowest prices.
GS/PD stock is 1.14% volatile and has beta coefficient of 0.21. Track Goldman Sachs Group, Inc. (The) Dep Shs repstg 1/1000 Pfd Ser D Fltg stock price on the chart and check out the list of the most volatile stocks — is Goldman Sachs Group, Inc. (The) Dep Shs repstg 1/1000 Pfd Ser D Fltg there?
Today Goldman Sachs Group, Inc. (The) Dep Shs repstg 1/1000 Pfd Ser D Fltg has the market capitalization of 241.20 B, it has increased by 0.49% over the last week.
Yes, you can track Goldman Sachs Group, Inc. (The) Dep Shs repstg 1/1000 Pfd Ser D Fltg financials in yearly and quarterly reports right on TradingView.
Goldman Sachs Group, Inc. (The) Dep Shs repstg 1/1000 Pfd Ser D Fltg is going to release the next earnings report on Oct 14, 2025. Keep track of upcoming events with our Earnings Calendar.
GS/PD earnings for the last quarter are 10.91 USD per share, whereas the estimation was 9.65 USD resulting in a 13.02% surprise. The estimated earnings for the next quarter are 10.94 USD per share. See more details about Goldman Sachs Group, Inc. (The) Dep Shs repstg 1/1000 Pfd Ser D Fltg earnings.
Goldman Sachs Group, Inc. (The) Dep Shs repstg 1/1000 Pfd Ser D Fltg revenue for the last quarter amounts to 14.58 B USD, despite the estimated figure of 13.51 B USD. In the next quarter, revenue is expected to reach 14.00 B USD.
GS/PD net income for the last quarter is 3.72 B USD, while the quarter before that showed 4.74 B USD of net income which accounts for −21.42% change. Track more Goldman Sachs Group, Inc. (The) Dep Shs repstg 1/1000 Pfd Ser D Fltg financial stats to get the full picture.
Yes, GS/PD dividends are paid quarterly. The last dividend per share was 0.33 USD. As of today, Dividend Yield (TTM)% is 1.63%. Tracking Goldman Sachs Group, Inc. (The) Dep Shs repstg 1/1000 Pfd Ser D Fltg dividends might help you take more informed decisions.
Goldman Sachs Group, Inc. (The) Dep Shs repstg 1/1000 Pfd Ser D Fltg dividend yield was 2.01% in 2024, and payout ratio reached 28.37%. The year before the numbers were 2.72% and 45.92% correspondingly. See high-dividend stocks and find more opportunities for your portfolio.
As of Oct 7, 2025, the company has 46.5 K employees. See our rating of the largest employees — is Goldman Sachs Group, Inc. (The) Dep Shs repstg 1/1000 Pfd Ser D Fltg on this list?
Like other stocks, GS/PD shares are traded on stock exchanges, e.g. Nasdaq, Nyse, Euronext, and the easiest way to buy them is through an online stock broker. To do this, you need to open an account and follow a broker's procedures, then start trading. You can trade Goldman Sachs Group, Inc. (The) Dep Shs repstg 1/1000 Pfd Ser D Fltg stock right from TradingView charts — choose your broker and connect to your account.
Investing in stocks requires a comprehensive research: you should carefully study all the available data, e.g. company's financials, related news, and its technical analysis. So Goldman Sachs Group, Inc. (The) Dep Shs repstg 1/1000 Pfd Ser D Fltg technincal analysis shows the buy rating today, and its 1 week rating is sell. Since market conditions are prone to changes, it's worth looking a bit further into the future — according to the 1 month rating Goldman Sachs Group, Inc. (The) Dep Shs repstg 1/1000 Pfd Ser D Fltg stock shows the sell signal. See more of Goldman Sachs Group, Inc. (The) Dep Shs repstg 1/1000 Pfd Ser D Fltg technicals for a more comprehensive analysis.
If you're still not sure, try looking for inspiration in our curated watchlists.
If you're still not sure, try looking for inspiration in our curated watchlists.