LAC trade ideas

LAC targetsLAC has been printing a very bullish pattern in the chart
Like in my previous post, it forms a double bottom and expected to hit $25 - which now is almost hitting. The daily candles has bene bullish and it's expected to break the resistance at $25. So what's next? being bullish on this stock, the next target is $37.How do I arrive at this price?
Usually it takes time for the chart to take a more reassuring pattern. Now it's actually forming a rounding bottom, it's might do a parabolic upward trend in price. For a rounding bottom, usually I will take the lowest and the highest price of the round bottom, and using exactly the similar percentage of gains of that to estimate the next target price.
The RSI looks really bullish and the volume is increasing. If it fails to surpass the resistance, it might retrace to $20 and begin its upward movement.

$LAC Lithium Americas ATH Trade Hopefully you find the chart helpful in terms of Supports & Resistance etc.
we refrain from adding commentary on the chart as that is reserved for our members and we are very conscious of not giving financial or trading advice.
Thank you for taking time to consult our chart and we would really appreciate a like, follow or comment.

A Pullback for LAC Is LikelyLAC is likely to revert to the 25 daily moving average for the following reasons:
1. The stock has gained nearly 40% in the last month with no major correction. Even though it has largely been mirroring the rise in Lithium futures, this rate of growth is unsustainable.
2. The daily price chart shows a very clear rising wedge pattern accompanied by both volume and RSI bearish divergence.
3. Aside from any TA patterns, the RSI has been hovering around 70 for the last couple of weeks which signals the stock is overbought.
4. The max pain price is roughly $17.50 for both Sept 17 and Oct 15 options which would suggest a correction will happen soon. In the rising wedge pattern, there isn't much time left.
My position is PUT options on Oct 15th at the 22.5$ pricepoint (marked by the red line).

$LAC Lithium Americas Corp Outperformance Continues.
Hopefully you find the chart helpful in terms of Supports & Resistance etc.
we refrain from adding commentary on the chart as that is reserved for our members and we are very conscious of not giving financial or trading advice.
Thank you for taking time to consult our chart and we would really appreciate a like, follow or comment.

ABC BullishPrice is outside the top bollinger band set on an 80 SMA verse 20. This exhibits extreme buying pressure and often overbought status. Price eventually returns to the bands as a rule.
ABC bullish. Possible stop under C or last pivot low. ABC is a common corrective pattern and the target is D.
Golden cross when the 50 SMA crossed up and through the 200 SMA. Looks like a cup is trying to form.
No recommendation.
Negative volume is high showing smart money interest. I am not sure they are smarter than we are, LOL, but you know what I mean.
A lot of momentum at this time. Long entry level can be crucial, and more so if a swing trade or a longer term investment. Having a plan for each trade can be important. If you do not have a plan, then what on earth do you do when things do not go your way? (o:

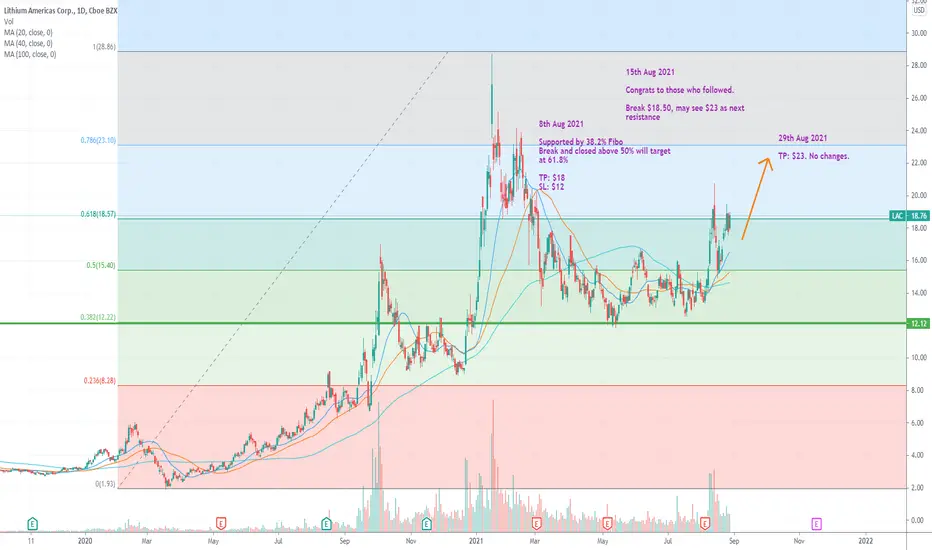
Bullish bias after pullback to 50% fiboPrice pull back to 50% fibo since hitting our first TP previously.
We are eying at $23 the next resistance level.
Continue to hold bullish
A clear Wyckoff accumulation Previously I have covered the target price of LAC at $20. Congratulations whoever who made some money from it.
Now the price is testing the support and seems like it's bouncing off from the support.
Weekly MACD crossed
Bullish divergence of RSI
I have reason to believe it will go to $25 from here. But it has to break the $20 resistance first


$LAC - AND I’M OUT$LAC - AND I’M OUT
I closed this position early today… I’ve just been holding it too long and I’m seeing so many other opportunities so… if you’re holding GL this can definitely still hit target… but I’m out
If you took some of those lower entries I posted than you probably did better than I did here. 🤣

LAC 5 waves down bear scenarioThis is if we break down in this triangle, we will see a wave 5 down to $8.

Bias on Upside since supported at 38.2% twice.Supported by 38.2% Fibo
Break and closed above 50% will target at 61.8%
TP: $18
SL: $12

Symmetrical Triangle - Watching closelySymmetrical triangle forming & Bollinger bands squeezing- watching closely for a breakout. Just some support and resistance levels to watch along with some RSI based supply and demand zones


Time to accumulate more Lithium Americas?A long term holding that may merit further accumulation?
www.reuters.com


LAXC LongNeeds to break $16.00-16.50 area for targets between $20-28. Calls $15-20 over next three months.

Lac I posted about this last week. Got in on a quick breakout trade around 13.80 took profits up in the green box around 15$ we hit 15.11. In expecting a move down to around my original entry between 13.80-13.92. If we can hold previous consildation resiatnce as new support we should get a good rip back to the upside!


LACI’m thinking about grabbing a position in LaC pretty soon. Looking at the Williams alligator which shows momentum in a trend we can see it’s starting to roll up. In the past when we got a 4hr candle close above the first green line we got a pretty solid up trend. We have been bouncing below 13.90 mainly that is the biggest reistance. According to keltner channels we have finally gotten above those resiatnce channels which to me is a great sign. The weekly isn’t as pretty but these smaller 4hr and daily time frames slowly turning cpuld lead to a better loookinf weekly chart this will be on my radar tomrorow to see if we can get above this 4hr green line on the Williams or hold above 14$

