OKE 1D Investment Short Conservative Trend TradeConservative Trend Trade
+ short impulse
+ T2 level
+ resistance zone
+ biggest volume Ut
+ weak test?
Bought a put
1 to 2 R/R ratio
1M Trend Trade
"+ short impulse
- neutral zone"
1Y CounterTrend Trade
"- long balance
+ biggest volume resistance level
+ volumed reaction bar"
Next report date
—
Report period
—
EPS estimate
—
Revenue estimate
—
5.45 USD
3.04 B USD
21.64 B USD
628.05 M
About ONEOK, Inc.
Sector
Industry
CEO
Pierce H. Norton
Website
Headquarters
Tulsa
Founded
1906
Identifiers
3
ISIN:US6826801036
ONEOK, Inc. engages in gathering, processing, fractionating, transporting, storing and marketing of natural gas. It operates through the following segments: Natural Gas Gathering and Processing, Natural Gas Liquids and Natural Gas Pipelines. The Natural Gas Gathering and Processing segment offers midstream services to producers in North Dakota, Montana, Wyoming, Kansas and Oklahoma. The Natural Gas Liquids segment owns and operates facilities that gather, fractionate, treat and distribute NGLs and store NGL products, in Oklahoma, Kansas, Texas, New Mexico and the Rocky Mountain region, which includes the Williston, Powder River and DJ Basins, where it provides midstream services to producers of NGLs and deliver those products to the two market centers, one in the Mid-Continent in Conway, Kansas and the other in the Gulf Coast in Mont Belvieu, Texas. The Natural Gas Pipelines segment provides transportation and storage services to end users. The company was founded in 1906 and is headquartered in Tulsa, OK.
Related stocks

ONEOK, Inc. (OKE)Company Overview
ONEOK, Inc. is one of the largest U.S. operators of midstream energy infrastructure, with assets spanning natural gas gathering, transportation, processing, and storage, as well as oil and petroleum product pipelines and storage. Founded in 1906, the company is headquartered in Tul

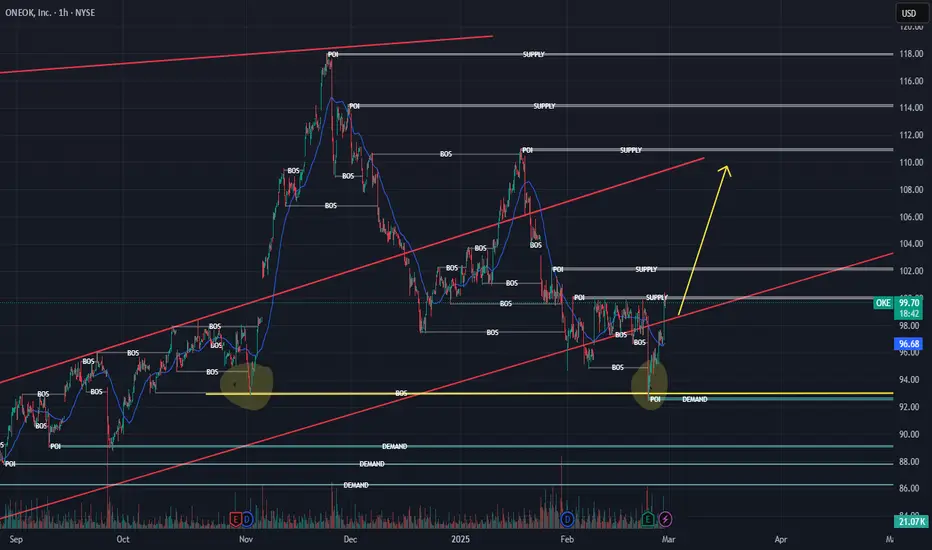
OKE Recovery in ProgressThe news cycle pushed the stock much lower than anticipated but seems to have recovered. Moving forward we can expect 2 scenarios with the stock price retesting long term trendlines or a continued rally fueled by increasing gas prices and Fed interest rate cuts.
The chart shows, in my opinion, 2 p

$OKE demonstrates solid long-term technical strength Technical Analysis
As of February 28, 2025, ONEOK Inc. (NYSE: OKE) is trading at $100.39. The stock has shown a bullish trend in the long term, while the short-term trend appears bearish. Key support levels are identified at $95.81 and $93.97, with resistance around $102.90.
The Relative Strengt

ONEOK Repeating Previous Patterns?Oneok continues to grow Y/Y and receive Analyst upgrades. After earnings, the stocks seems to experience a selloff and then a monster rally. I am predicting a rally to the upper resistance of the long term ascending channel.
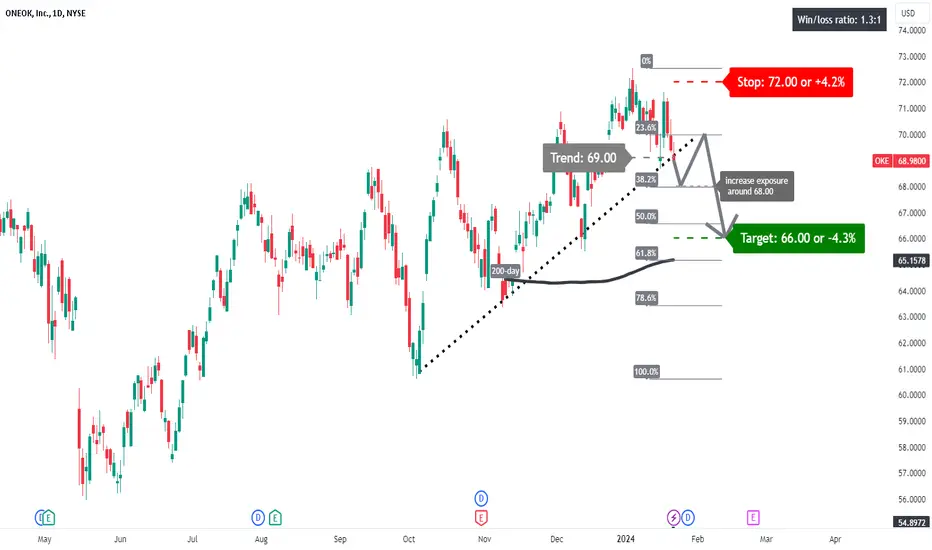
OKE: testing support?A price action below 69.00 supports a bearish trend direction.
Expect further downside potential for a break below 68.00.
The downside target price is set at 66.00 (just below its 50% Fibonacci retracement level).
The stop-loss price is set at 72.00.
Testing major support (see the black dotted trend
OKE Long PositionHi traders.
Let´s take a look at OKE analysis.
Wait for the price to retest the support line and enter the long position.
Our estimated target is 67.86$.
Enter and stop loss lines are indicated on the chart.
Good luck!

$OKE with a Bearish outlook following its earnings #Stocks The PEAD projected a Bearish outlook for $OKE after a Positive over reaction following its earnings release placing the stock in drift B with an expected accuracy of 55.56%.

$OKE ($XLE) Long Setup $OKE ($XLE) Other names in oil may need some exhaustion, however $OKE has a nice 212U M right now 🟢 , 212U 2Week 🟢 with short term target around 64-65. FTFC 🟢. Need Dec. cons at the least

ONEOK STOCK ANALYSISONEOK, Inc. engages in gathering, processing, fractionating, transporting, storing and marketing of natural gas. It operates through the following segments: Natural Gas Gathering and Processing, Natural Gas Liquids and Natural Gas Pipelines. The Natural Gas Gathering and Processing segment offers mi

See all ideas
Summarizing what the indicators are suggesting.
Neutral
SellBuy
Strong sellStrong buy
Strong sellSellNeutralBuyStrong buy
Neutral
SellBuy
Strong sellStrong buy
Strong sellSellNeutralBuyStrong buy
Neutral
SellBuy
Strong sellStrong buy
Strong sellSellNeutralBuyStrong buy
An aggregate view of professional's ratings.
Neutral
SellBuy
Strong sellStrong buy
Strong sellSellNeutralBuyStrong buy
Neutral
SellBuy
Strong sellStrong buy
Strong sellSellNeutralBuyStrong buy
Neutral
SellBuy
Strong sellStrong buy
Strong sellSellNeutralBuyStrong buy
Displays a symbol's price movements over previous years to identify recurring trends.
Curated watchlists where OKE is featured.

Midstream oil: The middlemen of the energy sector
35 No. of Symbols
See all sparks
Frequently Asked Questions
The current price of OKE is 73.59 USD — it has decreased by −0.37% in the past 24 hours. Watch ONEOK, Inc. stock price performance more closely on the chart.
Depending on the exchange, the stock ticker may vary. For instance, on NYSE exchange ONEOK, Inc. stocks are traded under the ticker OKE.
OKE stock has fallen by −3.49% compared to the previous week, the month change is a 6.15% rise, over the last year ONEOK, Inc. has showed a −29.38% decrease.
We've gathered analysts' opinions on ONEOK, Inc. future price: according to them, OKE price has a max estimate of 114.00 USD and a min estimate of 72.00 USD. Watch OKE chart and read a more detailed ONEOK, Inc. stock forecast: see what analysts think of ONEOK, Inc. and suggest that you do with its stocks.
OKE stock is 1.87% volatile and has beta coefficient of 0.86. Track ONEOK, Inc. stock price on the chart and check out the list of the most volatile stocks — is ONEOK, Inc. there?
Today ONEOK, Inc. has the market capitalization of 46.32 B, it has decreased by −3.14% over the last week.
Yes, you can track ONEOK, Inc. financials in yearly and quarterly reports right on TradingView.
ONEOK, Inc. is going to release the next earnings report on Mar 2, 2026. Keep track of upcoming events with our Earnings Calendar.
OKE earnings for the last quarter are 1.49 USD per share, whereas the estimation was 1.44 USD resulting in a 3.22% surprise. The estimated earnings for the next quarter are 1.54 USD per share. See more details about ONEOK, Inc. earnings.
ONEOK, Inc. revenue for the last quarter amounts to 8.63 B USD, despite the estimated figure of 8.78 B USD. In the next quarter, revenue is expected to reach 9.31 B USD.
OKE net income for the last quarter is 939.00 M USD, while the quarter before that showed 841.00 M USD of net income which accounts for 11.65% change. Track more ONEOK, Inc. financial stats to get the full picture.
Yes, OKE dividends are paid quarterly. The last dividend per share was 1.03 USD. As of today, Dividend Yield (TTM)% is 5.60%. Tracking ONEOK, Inc. dividends might help you take more informed decisions.
ONEOK, Inc. dividend yield was 3.94% in 2024, and payout ratio reached 76.55%. The year before the numbers were 5.44% and 69.76% correspondingly. See high-dividend stocks and find more opportunities for your portfolio.
As of Dec 13, 2025, the company has 5.18 K employees. See our rating of the largest employees — is ONEOK, Inc. on this list?
EBITDA measures a company's operating performance, its growth signifies an improvement in the efficiency of a company. ONEOK, Inc. EBITDA is 7.37 B USD, and current EBITDA margin is 28.45%. See more stats in ONEOK, Inc. financial statements.
Like other stocks, OKE shares are traded on stock exchanges, e.g. Nasdaq, Nyse, Euronext, and the easiest way to buy them is through an online stock broker. To do this, you need to open an account and follow a broker's procedures, then start trading. You can trade ONEOK, Inc. stock right from TradingView charts — choose your broker and connect to your account.
Investing in stocks requires a comprehensive research: you should carefully study all the available data, e.g. company's financials, related news, and its technical analysis. So ONEOK, Inc. technincal analysis shows the buy rating today, and its 1 week rating is sell. Since market conditions are prone to changes, it's worth looking a bit further into the future — according to the 1 month rating ONEOK, Inc. stock shows the neutral signal. See more of ONEOK, Inc. technicals for a more comprehensive analysis.
If you're still not sure, try looking for inspiration in our curated watchlists.
If you're still not sure, try looking for inspiration in our curated watchlists.