PFE LongPFE as market a local bottom in my opinion. It breached the lows of a long consolidation and reversed soon after. It also seems to be forming a triangle on the monthly timeframe
PFE trade ideas

$PFE Pfizer. Rounded bottom breakoutNice rounded bottom breakout and retest @ $29,30 level. If this level holds the target would be $33,50. 15% Upside on a good dividend payer.

PFE to take off soonNYSE:PFE Pfizer made a classic reversal and is now in retraction before next move up.
Is a long-mid time trade, anyway you will have around 6% dividends on your way as reward for waiting.

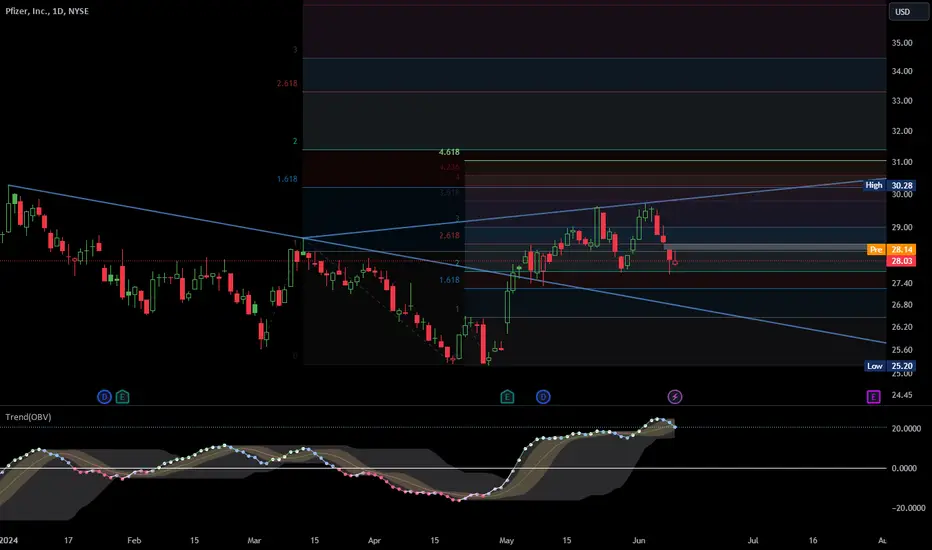
Pfizer Combo3 simple potential zones of influence I will be interested in if the price will start descending, for both types of scenarios: consolidations or complete reversals. Also interested in the green curve in case the price finds support there and doesn't look like it can penetrate decisively below after earnings report.

$PFE long ideaSome significant support here on the weekly chart. I got in a few days ago.. Risk reward ratio worth the long here. Always manage risk so you can live to trade another day! This is not financial advice of course. Please do your own research & Happy Trading!

PFEPFE consolidates after a flat correction. Larger frame analysis is in the updates below.
Tracking this stock for a long time. Now its time to go up
Manage your risk. Don't overconcentrate individual positions, let them concentrate themselves as the winners grow.

PFE breakout PossibleHolding strong support
29 above trendline breakout Possible
31/33/36 can test soon

Pfizer (PFE) AnalysisOverview:**
Pfizer Inc. (PFE) has been in a prolonged downtrend but is showing signs of potential recovery. The recent chart indicates a bounce from the lows, with key technical indicators suggesting a possible reversal.
**Technical Analysis:**
1. **Fibonacci Retracement Levels**:
- The chart shows Fibonacci retracement levels drawn from the recent high to the low. The stock has rebounded from the lower levels and is currently testing the 23.6% retracement level around $29.50. A sustained break above this level could target the next resistance levels at $32 and $35.
2. **Moving Averages**:
- The stock has moved above the short-term moving averages (indicated by the green and blue lines), which suggests bullish momentum. If it can maintain above these levels, it could attract more buying interest.
3. **MACD and RSI**:
- The MACD indicator shows a bullish crossover, and the histogram has turned positive, indicating increasing bullish momentum.
- The RSI is rising from oversold territory, currently at 87.03, which suggests strong buying pressure but also warrants caution as it nears overbought levels.
**Fundamental Perspective:**
- **Recent Developments**:
Pfizer's ongoing developments in its drug pipeline, including advancements in COVID-19 treatments and vaccines, continue to provide long-term growth potential. Investors should keep an eye on upcoming earnings reports and updates on key products.
- **Valuation**
The current price level may represent a value opportunity given Pfizer's strong balance sheet and consistent dividend payments. The company has a history of generating significant free cash flow, which supports its ability to invest in new research and return capital to shareholders.
**Conclusion:**
Pfizer appears to be at a crucial juncture, with technical indicators suggesting a potential trend reversal. Investors should monitor the $29.50 level for a possible breakout and consider the broader market conditions and Pfizer’s upcoming announcements for further confirmation of the bullish trend.
**Risk Management:**
- Set stop-loss orders below recent lows to manage downside risk.
- Consider scaling into the position to mitigate the impact of volatility.
**Disclaimer**: This analysis is for informational purposes only and should not be considered as financial advice.
Dr SAUD

Pfizer Big buy opportunity!After long time of sell pfizer has reached a really good buy opportunity!
buy now for a 20.59 R/R

Pfizer: This sell off is nowhere near finished
Pfizer has been getting pushed like crazy on CNBC by fund managers like Josh Brown as a good buy and after looking at the charts above its very easy to see why. Wallstreet pricks like Brown are trying to offload their last remaining shares on unsuspecting retail buyers.
As you can see in the first chart on the daily timeframe, Pfizer is below the 200 and tried 3 different times to get above it and failed. In the second chart on the monthly timeframe, Pfizer is now below the 200 on the Monthly and is now consolidating, the last time this happened was back in 2009 and after consolidating below the 200 for 3 months, it tanked 50% for 15 months in a row, from $22.50 down to just under $13 a share. Pfizer will not be a buy for a long long time
NYSE:PFE

Ready to explode!We have everything in place…
A double bottom
A channel down breakout
An inverted head and shoulder forming out

PFE - Will The Strong Downtrend Ever Be Retested? My thoughts showing how an extended bear move could result in the downward test of a previous bear trend line
I do expect however that one of the green trend lines will hodl so I have put price labels on each of those. It is more likely to continue up than to make this horrid move.
Imagine it going down to $3!

PFE Long 1D Conservative Trade DCAConservative Trade
"+ long balance
- volumed expanding ICE
+ support level
+ volumed 2Sp-"
Monthly context
"- short impulse
+ 1/2 correction of 15 years long trend
+ historical volume
- resistance level"
There's no trading signal, but I like volume distribution on daily, so started to accumulate shares little by little.
No stop loss or take profit at this point, we'll be adding as we go.

PFIZER, targeting $50! Upside Prospect ON!PFE weekly data is conveying significant accumulation at the current price range.
Net positive volume has been increasing on a daily basis for the past few days -- in anticipation of the company's incoming price growth, long term.
The stock is currently sitting at 78.6 FIB level -- a discounted level where buyers converge.
Expect some significant bounce from the current range with initial target to $50.
Weekly higher lows on histogram has been registered. Trend shift is about to commence.
First Bubble up volume appearance in almost 2 months.
Spotted at 38.0
TAYOR
Safeguard capital always.

peeking $PFE's levels to manage my positionPfizer Inc. is the best gene therapy stock to buy now.
Pfizer expects an FDA decision for Marstacimab, a potential once-weekly subcutaneous treatment for hemophilia B. They also started a Phase 3 study for osivelotor in sickle cell disease.
New Product Approvals: Pfizer’s recent product approvals include Abrysvo RSV vaccine, Velsipity (etrasimod) for ulcerative colitis, Penbraya pentavalent meningococcal vaccine, Zavzpret nasal spray for migraine, Litfulo (ritlecitinib) for severe alopecia areata, and Beqvez (fidanacogene elaparvovec), a one-time gene therapy for hemophilia B.
Pfizer Inc ideaPfizer Inc idea
Safe to enter above $27.18
we may see a new low below $25
Technicals are on positive side..

Pfizer !!! low risk , 20% Gain till next month ?? Hello everyone, today I want to discuss Pfizer's stock which experienced a 58% correction from its peak price and is currently trading around $26. I believe this stock has a lot of potential for both scalpers and long-term investors. With a dividend yield of 6.65% at this price, it's an attractive investment option. Additionally, the earnings report due this week could boost the stock price to $30 by next month. You can refer to the chart for trade stop and stop-loss points.
Disclaimer: This information or service is for informational purposes only and is not
intended to be personal financial advice
#pfizer


Buying Pfizer!! is it a good moment?? what's the upside ??Details are on the chart as always.
Along term buy for me personally I guess. This is not an advise to buy or sell any stock.
learning the strategies to improve.

Trade Like A Sniper - Episode 16 - Pfizer - (5th June 2024)This video is part of a video series where I backtest a specific asset using the TradingView Replay function, and perform a top-down analysis using ICT's Concepts in order to frame ONE high-probability setup. I choose a random point of time to replay, and begin to work my way down the timeframes. Trading like a sniper is not about entries with no drawdown. It is about careful planning, discipline, and taking your shot at the right time in the best of conditions.
A couple of things to note:
- I cannot see news events.
- I cannot change timeframes without affecting my bias due to higher-timeframe candles revealing its entire range.
- I cannot go to a very low timeframe due to the limit in amount of replayed candlesticks
In this session I will be analyzing PFE (Pfizer), starting from the 4-Month chart.
- R2F

$PFENot financial advice.
Per the STRAT system
NYSE:PFE
Scenario #1 in the monthly candle already went bullish reversal. If we break yellow line will go on a PMG (pivot machine gun) target on small yellow lines.
Scenario #2
we reverse and break white line will go to the bottom of the channel.
Like and follow for more ideas

Analysis of PFE Price: Is the Stock Undervalued?Analysis of PFE Price: Is the Stock Undervalued?
Yesterday, the price of Pfizer's stock rose by more than 2.2%, while the S&P 500 index remained almost unchanged from the opening to the closing of trading. This fact is noteworthy, considering that for many months the price of PFE stock performed worse than the market - if the S&P 500 grew by 23% during 2023, then the price of PFE decreased by approximately 43%.
The decline in 2023 (shown by the red channel) was disappointing. But what about now - is the situation changing? Are investors missing out on something important by turning away from PFE?
Several factors indicate that PFE stock may have optimistic prospects.
Fundamentally - Investors Place has included PFE in the list of the most undervalued stocks for reasons such as:
→ 2023 saw a record number of FDA approvals. New drugs could boost sales.
→ Pfizer acquired Seagen, significantly expanding its capabilities in cancer research. This supports the company's strategy to become a world-class leader in oncology.
→ By 2030, Pfizer plans to release 8 drugs that could become "blockbusters."
From a technical analysis perspective of the daily chart of PFE:
→ Attention is drawn to the 3 candles from December 13-15, 2023 - on each of these days, over 100 million shares were traded on the NYSE, which is unusually high for this market. Large investors may have been building long positions - as the price of PFE rose out of the zone marked by the 3 candles in purple.
→ Throughout 2024, the price attempted to drop below the indicated zone, but each time it did not make progress.
→ The decline on April 25 looks like a Final Shakeout pattern in Richard Wyckoff's terminology, indicating the completion of the stock accumulation process.
The price action in May 2024 looks extremely bullish:
→ PFE stock is outperforming the market.
→ The RSI indicator remains above the level of 50.
→ The downtrend has been broken.
According to TipRanks, the average forecasted price of PFE stock by Wall Street analysts is $33.15 (+13.10% from current levels).
Buy and sell stocks of the world's biggest publicly-listed companies with CFDs on FXOpen’s trading platform. Open your FXOpen account now or learn more about trading share CFDs with FXOpen.
This article represents the opinion of the Companies operating under the FXOpen brand only. It is not to be construed as an offer, solicitation, or recommendation with respect to products and services provided by the Companies operating under the FXOpen brand, nor is it to be considered financial advice.

PFE.NYSE Pfizer a Bottom Drawer for +80% ?Pfizer as we can see has been punished of late.
However there are signs of a pending reversal.
I am only adding a 3% position of this in my long term portfolio for a +80% upside.
Dedication will be required and is a +2 year Study.
As always, please get a few outside Expert's Advice before taking Trade or Investment Decisions.
Should you appreciate my Chart Studies, Smash That Rocket Boost Button. It's Just a Click away.
Regards Graham.
