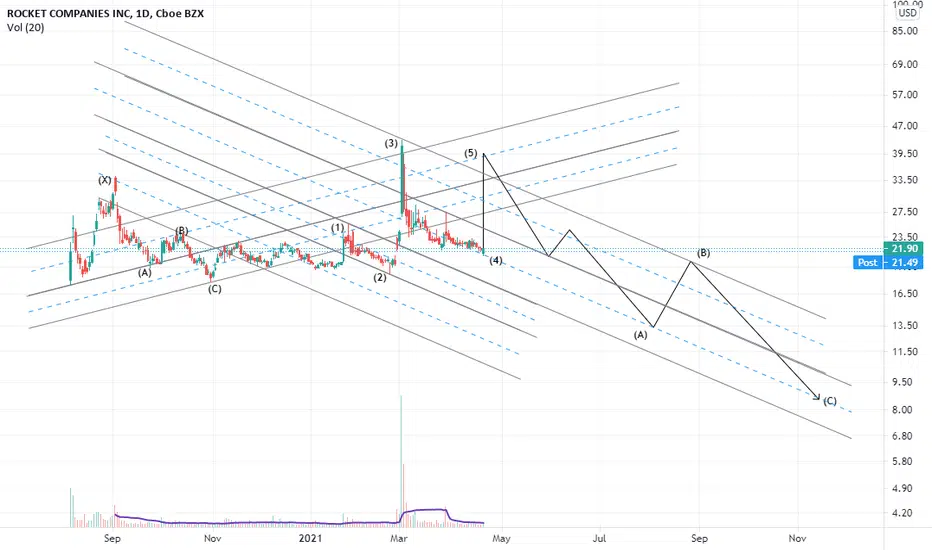
a pop to $40 and then sinking!butterfly harmonic pattern:
(4)=0.78 (3)
(5)=0.88 (4)=$39
(A)=1.6 (5)=1.27 (3)=$14
(B)=0.38 (A)=$20
(C)=2.24 (5)=$8.5
RKT trade ideas
RKT - SHORT SHORT SHORTRKT has been trading below the 6-8-21 day sma and struggling to break through these moving averages which signals bearish. It's sitting above the 50day sma which is using it has a support. If RKT fall below the 50day sma I'd look to enter a short position and gap fill all the way down to the $19.50-$20 area.
Contract Suggestion:
RKT 4/30 21P @ .50

Potential value area. (part II)I hadn't realized in my last idea the Chart had been shifted somehow someway ( the back and forth between time and log scale maybe? ). My sentiment remains the same and here are the fixed visuals. I'll rethink my Bullish bias if 20$ somehow flips into resistance and / or Market Bulls capitulate.


Pattern on RKT. Looking at the daily chart on RKT i see a pattern that isnt that difficult to find. If you look at previous earnings prior to them you will see that the stock trades sideways, and then there is a move up on the day of earnings or after earnings. This is a great company with record numbers and there earnings were off the charts. Dont understand how this isnt trading at a higher price, but would expect this to eventually move up. MACD is in the red right now and it seemed like it was ready to go green, but the market went red again and hopefully it turns green soon.

Potential value area approaches Price action continues to be pinned down after the dividend pump to all time highs of $43. After being rejected by the .618 of the swing low 17.50 to new ATH 43.00, we are trading between both .786's Price action looks to test both previous downward sloping supply lines which happen to also align between the .886's. If this area does in fact serve as support and the new demand zone, I see 21.50- 20.50 as a potential value area for a swing trade.

Third leg upRkt has the same low volume and candle formation at the last two highs get ready for the third leg up

ROCKET LAUNCH, STAGE 1You can clearly see cycles on every indicator as well as on the candles. It looks like we are going to have a big increase soon.


RKT Update - Watch for today's closePreviously posted to wait for earnings:
RKT did well in earnings as expected and seem to be starting to rally. If it closes above the trend line above 23.70 today it should be a good sign to add to position. In my opinion RKT's price has been held down for some time and should see a bigger rally within a few months.

RKT could breakout again.Looking at the daily chart on RKT and if you look at the MACD it looks like it is ready to close red and turn green. RSI is heading up and friday saw some volume which i think was the reason for the move up on friday.

LEVELS TO WATCH FOR RKTMajor support under 23.4, expect a little dip to that at market open and over the day watch for general resistance around 26.5. I feel if we can break 26.5 we can drive it up again. Let's this bread. Buy options while they are cheap. Expect the price to hit $50 this month at some point.

Falling wedgeAfter the huge seloff, we might have a trend reversal, and make a higher low on a higher timeframe.
If we manage to breake the upper resistance, then we might see some nice rally.

BULLISH ASF. Get your positions in now, going to the moon!!!If we break up in aftermarket I would get options to call in around $50 for the end of April while they are cheap.

RKT HIGH/LOW Dates Fits this Sine Wave Fairly WellThis sine wave fairly well predicts the dates (not the values). This is only an observation. I like patterns. This is not trading advice. I think it will be interesting to see if the pattern holds.

$RKT Classic Wyckoff Accumulation Timed to Max Pain & Div Reinv.Tracing a classic accumulation pattern, but would need catalyst and volume to break out of selling pressure.

RKTSHORT-TERM: Flipping a previous resistance into a support at the .786 retrace, just pretty easy to manage risk here. Low risk high reward, medium probability trade. (not financial advice)

RKTRKT not being a rocket, Fell out of the Consolidation box and testing Fib Retracement. If it holds can reverse back to 28-30 range.

Rocket Companies RSI is oversoldRocket Companies RSI is oversold on the one hour chart, 6 week view. Mortgage rates are now at the highest point since June 2020 and could go even higher even if the Federal Reserve doesn’t change its low interest rate policy. Mortgage rates roughly track the direction of the 10-year Treasury, 1.735%. Ten-year Treasury rates are on an upward trend since August 2020, but mortgage rates were still falling until February. As of Thursday, the 30-year fixed-rate mortgage averaged 3.09%, up four basis points from the week earlier. It was hard to fit this chart inside the box because of WSB price action in early March, but nevertheless, I think RKT is a solid company, p/e = 14.68, with good growth in the future. Rocket Companies (RKT) reported Quarter December 2020 earnings of $1.12 per share on revenue of $4.7 billion. The consensus earnings estimate was $0.86 per share on revenue of $3.8 billion. It's a mortgage and eCommerce businesses – including Rocket Mortgage, Amrock, Rocket Homes and Rocket Auto. Do your own due diligence, your risk is 100% your responsibility. You win some or you learn some. This is for educational and entertainment purposes only. Consider being charitable with some of your profit to help humankind. Good luck and happy trading friends...
*3x lucky 7s of trading*
7pt Trading compass:
Price action, entry/exit
Volume average/direction
Trend, patterns, momentum
Newsworthy current events
Revenue
Earnings
Balance sheet
7 Common mistakes:
+5% portfolio trades, risk management
Beware of analysts motives
Emotions & Opinions
FOMO : bad timing
Lack of planning & discipline
Forgetting restraint
Obdurate repetitive errors, no adaptation
7 Important tools:
Trading View app!, Brokerage UI
Accurate indicators & settings
Wide screen monitor/s
Trading log (pencil & graph paper)
Big organized desk
Reading books, playing chess
Sorted watch-list
Checkout my indicators:
Fibonacci VIP - volume
Fibonacci MA7 - price
pi RSI - trend momentum
TTC - trend channel
AlertiT - notification
www.tradingview.com

$RKT Strong support at the .786 retracementHas been consolidating for almost 2 weeks at this level close to 24. Let see if this bounces back to 30 in the next few weeks

RKT back to Thetaganger's dreamBefore the moon trip, RKT was range bound very well, easily predictable, and had decent premiums for very consistent oscillations. Now it seems back to that range, but slightly higher, with premiums even juicer.
Wheeling RKT has an asymmetrical risk where assignment gives you a company that had stellar earnings, a dividend, and a juicy meme factor. Selling CSPs and CCs at or slightly out of support and resistance is easy money. Currently, ATM options are netting 5% weekly
