Wells Fargo & Company — Buy Side | 97Wells Fargo & Company is presenting a constructive upside setup, with the current price structure creating room for a further advance toward the 97 level. The recent formation is showing improving upward participation, while the broader configuration leaves scope for buyers to extend the move.
The technical picture is supported by strengthening price behavior and a developing positive sequence. If this structure continues to hold, the stock can work through successive higher levels as buying mo
In-depth trading ideas
WFC LONG — 4H ALMA Averaging Setup (WR 74% · avg RR 1.2)My BoaBias ALMA Averaging Strategy is managing an open long position on $NYSE:WFC.
The position was opened in four entries between August 21 and October 1. This is a systematic mean-reversion setup generated by the same strategy framework used across my portfolio.
Why I’m in the trade
ALMA Averaging is a countertrend strategy. It looks for long opportunities when price is trading below the ALMA averages, where the setup is based on potential mean reversion.
All 4/4 lots are filled . The p
Wells Fargo & Company. WFC
Wells Fargo & Company is a diversified U.S. financial services company providing banking, lending, investment, and wealth-management services to individuals, businesses, and institutions.
From a technical perspective, the primary focus is on the lower-timeframe structure. Once a **confirmed shift from bearish to bullish market structure** is established, the setup provides a framework for evaluating continuation toward the previous highs and broader resistance areas.
**Key technical observat
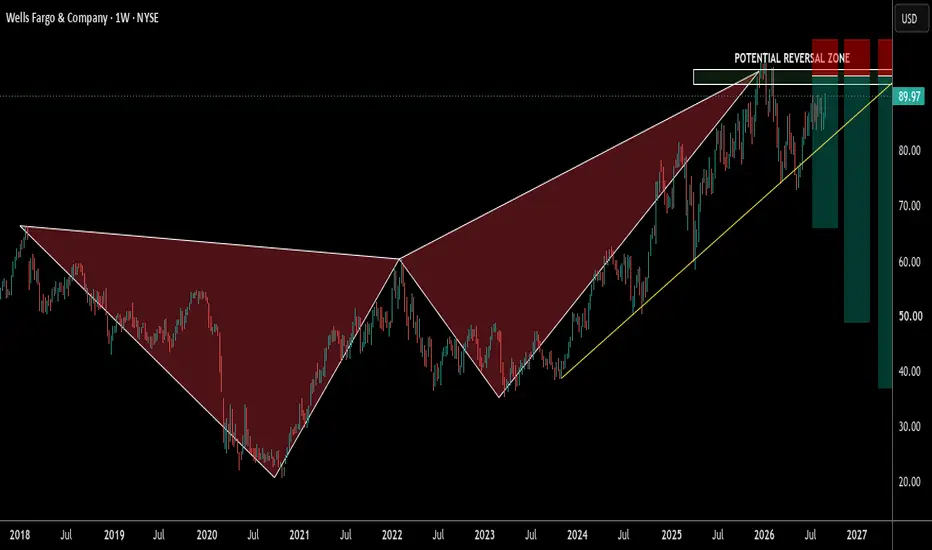
WFC — Bearish Crab: Possible Second RejectionWFC has already rejected the Potential Reversal Zone once, making the current setup interesting as price approaches the same area again.
A second rejection from this zone could provide another opportunity for the Bearish Crab pattern to play out. The key is whether sellers step in again and prevent price from breaking above the reversal zone.
The yellow trendline is also important for confirmation. It has been supporting the recent move higher. A break below this trendline would add confirmati
LONG WFC - Inverse H&S Breakout + Stellar Fundamentals📍 ENTRY: $86.96
🛑 **STOP LOSS:** $82.86 (Risk: $4.10)
🎯 **TAKE PROFIT:** $95.95 (Reward: $8.99)
📊 R:R RATIO: ~1:2.2
🔍 TECHNICAL ANALYSIS (The Signal):
We have a clear Inverse Head and Shoulders (H&S) pattern forming on the daily chart, with the neckline sitting around the $87.50 zone.
Today's candle showed a decisive breakout above the neckline, accompanied by notably higher-than-average volume—confirming the validity of the move.
Price is trading comfortably above the 200 SMA, which is acti
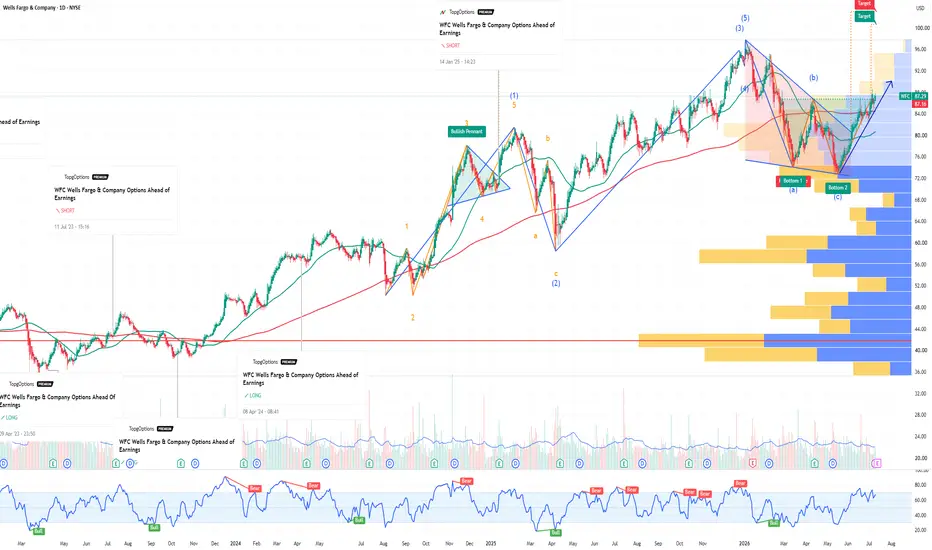
WFC Wells Fargo & Company Options Ahead of EarningsIf you haven`t bought WFC before the rally:
Now analyzing the options chain and the chart patterns of WFC Wells Fargo & Company prior to the earnings report this week,
I would consider purchasing the 88usd strike price Calls with
an expiration date of 2026-7-24,
for a premium of approximately $2.09.
If these options prove to be profitable prior to the earnings release, I would sell at least half of them.
Wells Fargo Breaks Out from Double-Bottom Base amid RotationAs capital continues to rotate into the financial sector, many financial stocks are building strong uptrends, and WFC is beginning to participate in the move. The stock has broken above and successfully retested the $83 level from a double-bottom base, signaling the start of a new uptrend supported by key moving average cross.
Wells Fargo & Company is a $261.68 billion market-cap bank holding company and diversified financial services provider. The company operates through three segments: Commu
Wells Fargo setting up for a short‑term bounce toward $90:Current Price: 85.4 (Analysis was generated on Monday Morning)
Direction: LONG
Confidence level: 54%(Professional trader snippets mainly referenced the upcoming bank earnings cycle without strong bearish positioning. With price holding near support and broader technical momentum upward, the bias favors a short-term bullish move despite limited explicit signals.)
Targets
Target 1: 88.00
Target 2: 90.00
Stop Levels
Stop 1: 84.00
Stop 2: 82.80
Key Insights:
Here's what's driving this setup. Se
WELLS FARGO | Historical Bounce Setup at $88 Critical Support?Wells Fargo missed revenue expectations this quarter, reinforcing the same top-line weakness seen across US banks. While EPS was supported through cost discipline, the lack of revenue growth points to slowing loan demand and tighter credit conditions.
When viewed alongside JPMorgan’s EPS and revenue miss, the banking sector is increasingly flashing late-cycle behaviour (Defensive).
Technical View (4H)
The technicals suggest Wells Fargo is now approaching an area where buyers have consistent
Wells Fargo Earnings Play — High-Confidence Call Alert!WFC Earnings Signal | 2026-01-13
Direction: BUY CALLS
Confidence: 78% (High)
Expiry: Jan 16, 2026 (3 days)
Strike: $87.50 (Deep ITM)
Entry: ~$6.95
Target 1: $10.42 (+50%)
Target 2: $13.90 (+100%)
Stop Loss: $5.21 (‑25%)
Position Size: 4% of portfolio
Why Trade:
WFC has a 100% earnings beat record over last 4 quarters
Current dip (-1.37%) = lower-cost entry
Katy AI predicts run-up to $95.61–$95.87 on earnings day
Institutional accumulation detected (volume 1.2× avg)
Risk Notes:
Medium ris
Wells Fargo Rose 33% in 2025. Here's Its Chart Ahead of EarningsWells Fargo NYSE:WFC rose more than 20% in the past three months and 32.7% in 2025, beating the S&P 500 SP:SPX in both time periods. What does its chart and fundamental analysis say as the bank prepares to release Q4 results?
Let's take a look:
Wells Fargo's Fundamental Analysis
Earnings season kicks off in earnest this week, with the largest U.S. banks reporting first -- including Wells Fargo on Wednesday before the bell.
Analyst expectations for the banks are coming in a bit hot this
WFC Wells Fargo & Company 1Y Chart Review - What's NextToday you can review the technical analysis idea on a 1Y linear scale chart for Wells Fargo & Company (WFC).
It seems there is some action going on here with WFC reviewing the Fibonacci, Trends, and RSI. This may be a concern.
If you enjoy my ideas, feel free to like it and drop in a comment. I love reading your comments below.
Disclosure: This is just my opinion and not any type of financial advice. I enjoy charting and discussing technical analysis. Don't trade based on my advice. Do your o
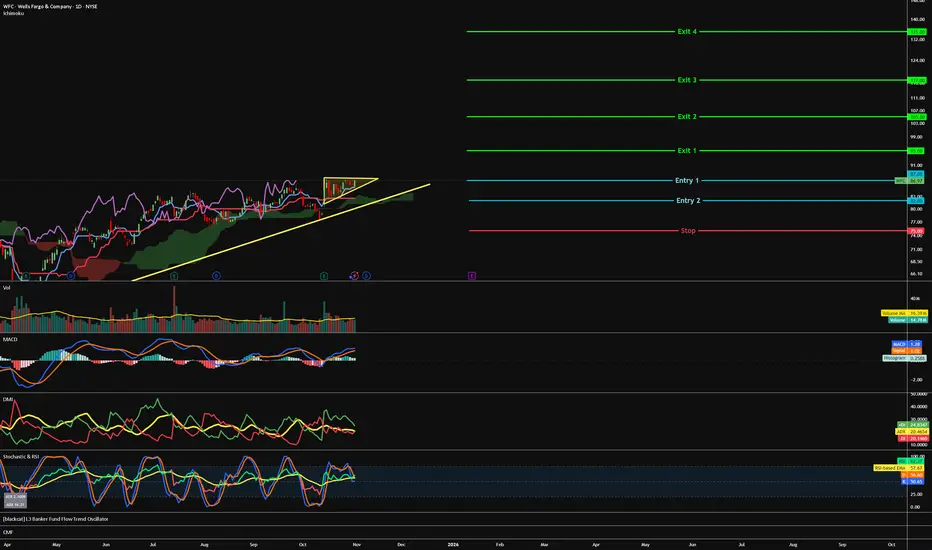
WFC - Ascending to the top=======
Volume
=======
- Neutral
==========
Price Action
==========
- Ascending triangle
- Supported on uptrend line
=================
Technical Indicators
=================
- Ichimoku
>>> price above cloud
>>> Green kumo expanding
>>> Tenken - Above clouds & Lagging & pointing up
>>> Chiku - Above clouds & flat
>>> Kijun - Above clouds & above Conv + Lagging, pointing up
=========
Oscillators
=========
- MACD still bullish
- DMI still bullish
- StochRSI, bullish, approaching overboug
US banks on shaky ground Macro conditions are turning hostile. The commercial real estate market, especially office, is structurally impaired in certain segments. Vacancy rates in major US metros are above 20%. Office prices are down 30–40% from their 2022 peaks. With over $1.2 trillion in CRE debt maturing by 2027, refinancing risk is climbing, fast.
Wells Fargo is sitting in the crosshairs. Its latest earnings showed net interest income down 13% year-on-year. Revenue fell 6%. The top line is weakening just as credit
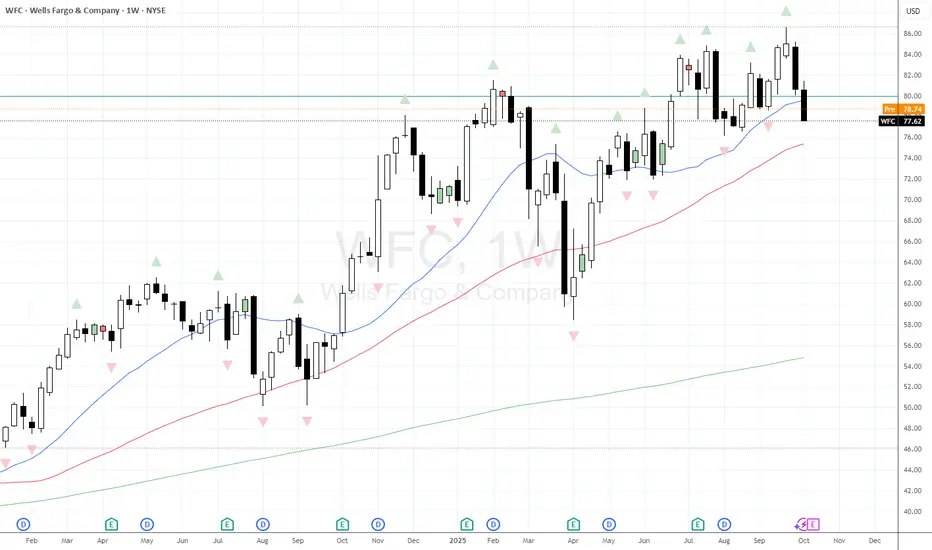
$WFC following through on weekly evening starLike other financial companies the sheen has come off #WFC recent chart. Even before Fridays market tantrums we saw price printing a weekly bearish evening star, and then last week we closed beneath the Weekly 20MA. Will WFC earning tomorrow provide fuel for a move lower, or rescue this decline? Watch and shoot.
Wells Fargo Beat the S&P 500 Over 12 Months. What Its Chart SaysWells Fargo NYSE:WFC will report earnings next week at a time when the banking giant's stock recently hit an all-time high and is beating the S&P 500 SP:SPX on a one-year and five-year basis, but trailing more recently. What does the stock's technical and fundamental analysis show?
Let's check it out:
Wells Fargo's Fundamental Analysis
WFC will be among one of the first major companies to report Q3 earnings, unveiling results next Tuesday as several large banks head to the tape.
A trad
WFLWe’re maintaining a bullish outlook on Wells Fargo. After a sustained period of consolidation, the stock has now broken through its RSI trend line to the upside – a classic technical signal indicating strengthening momentum and a potential continuation of the uptrend.
Why we’re bullish on WFC:
Momentum Shift – The recent breakout above the RSI trend line shows buyers are regaining control.
Strong Support Levels – Price action has consistently held above key support zones, reflecting strong un