NZDCAD BULLISH!Structure is what im looking at... We have a previous resistance which has been broken through and is now support. Classic textbook. Prime for buys.
NZDCAD trade ideas


NZDCAD November 16th, 2023The NZDCAD has been in a bearish trend since December 2022, forming a descending resistance trendline. The price is currently touching this resistance.
Possible Scenario 1: Breakout to the upside
If the price breaks above the resistance trendline, it could signal a reversal to the upside. This would be a bullish signal, and traders could look to buy NZDCAD.
Possible Scenario 2: Breakdown to the downside
If the price breaks below the resistance trendline, it could signal a continuation of the bearish trend. This would be a bearish signal, and traders could look to sell NZDCAD.
Possible Scenario 3: Bounce off the resistance trendline
The price could also bounce off the resistance trendline and continue to trade sideways. This would be a neutral signal, and traders would need to wait for further confirmation before taking a position.

TRADE IDEANZDCAD I think we sell because of the chart pattern and trend movement. It is crucial to understand the nature of the market and what the market is telling you from its perspective. i think we sell to 0.7700

NZDCAD PULLBACK IN A TREND IS AN OPPORTUNITYAfter a laggard journey to upward the pair has succumbed to the selling pressure and price has significantly come down resultantly we are seeing a pullback or dead cat bounce. These are good opportunities for the late comers.
So you may join in and enjoy the ride.
For your convenience trade trigger point, stop loss and TPs have been marked of the chart.
Have a profitable trading.

nzdcadIf the desired level is broken, due to the failure of the long-term descending channel, the possibility of increasing the price and reaching the desired target is high.

Time to fallbackConfluences
1. Long-term Downtrend.
2.Near trend line resistance and supply area.
3.Did not create higher high at 8hrs time frame.
4.Shooting star candle stick at Daily time frame.
5.4Hr time frame MA is pointing down.
Entry 0.81200
Stop loss 0.82100 (Slightly above last swing high)
TP1 0.80000 (1st support area)
TP 2 0.78515 (Near bottom channel)

NZDCADWe are in a first area of interest for a bullish reaction of this asset. But remember to protect the operation in the marked area. As a compensatory operation we have another marked in an interesting area due to an extreme weekly drop in the asset in question.

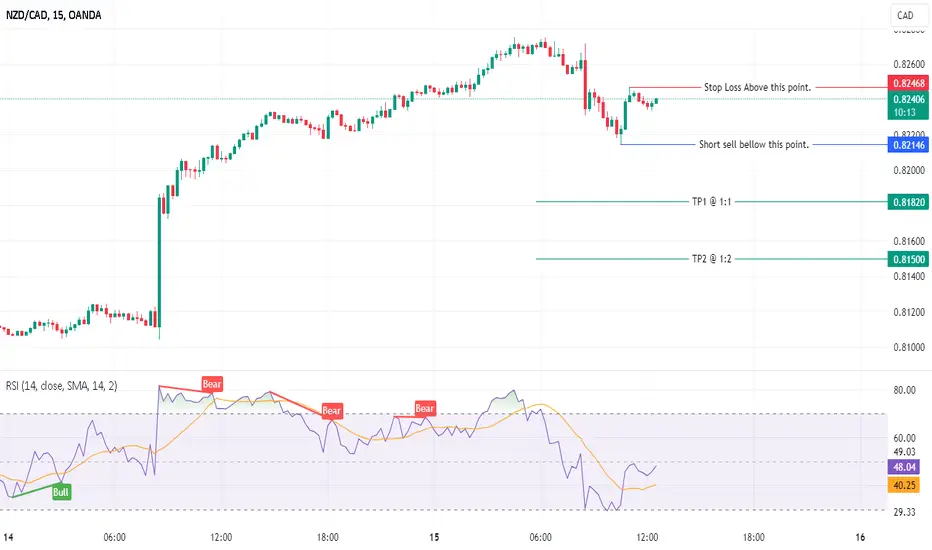
NZDCAD ShortNZDCAD Short (Analysis at 4 hour)
Short entry trigger if it break support, then retest and make LH
SL ,TP mention in chart
RR 1:1.45

NZDCAD LONG#Repost(Updated Analysis)
All Structure was respected on all Time Frames
Market Structure Bullish on Higher Time Frames (Weekly Daily H4)
Weekly And Daily in the same AOI
Daily Rejection at AOI
Daily EMA Retest
H4 EMA Retest
REMEMBER: Trading is a Game Of Probability
: Manage Your Risk
: Patience Pays
: Every Moment Is Unique
: Rinse, Wash, Repeat!
: Stay Hydrated
#Follow#Share#Comment#Boost

NZDCAD - Bearish Double TOP 📉Hi Traders !
On Friday 3 Nov, The NZDCAD Price Reached a Resistance Level (0.82092 - 0.81964).
-The NZDCAD Failed To Create a New Higher High.
-The Price Formed a Double TOP Pattern.
Currently,
-The Neckline is Broken.
So I Expect a Bearish Move !
i'm waiting for retest...
-----------
TARGET: 0.80100🎯

NZDCAD possible expansionPrice is in a bullish trend as it has been breaking highs and respecting lows. It broke the previous high with momentum where it receded to consolidate and retrace gradually, forming liquidity in the process. Due to the nature of this break, price could use the latest strong low as liquidity to reach for a demand zone that was previously unmitigated before expanding upwards to take out our higher timeframe weak swing high.

NZDCAD 4hrs SELLPrice has broken the uptrend and that indicates a change of direction.
We would be expecting price to push to around 0.79795

NZDCADIs NZDCAD exhausting at highs?
As the price is been on high bull run but now it seems like price is lacking bullish momentum after printing double top pattern at resistance level and bearish divergence suggesting the sell pressure is about to start.
If the bears took control , the 1st target could be 0.8040 followed by 0.800.
What you guys think of it?


NZDCAD BUY Could this be a possible BUY for NZDCAD?
Based on what price action is showing, the market is currently bullish, and it looks like the correction could be over.
Lets see what happens next.
Remember that trading is a probability

NZDCAD : SellDaily Trendline
Price has reached the DAILY TRENDLINE and rejection has occurred
1Hour Trendline
On the 1 HOUR TRENDLINE, the price has broken the trendline.
Conclusion
Thus, it is very likely that the price will continue the DAILY TREND in the form of a decline towards the support of 0.79690 and the next support at 0.79045.
#sekut

NZDCAD SHORT - BIG BEARISH SWING!Waiting for a retest of 0.81278 to short NZDCAD back to 4H swing low at 0.79750
If you agree drop a like and if you have any questions leave a comment :)

🔹 NZDCAD, Short, ICT Swing Trade 🔹📣 Attention Traders! 📈🔍
🔹 NZDCAD, Short, Swing Trade 🔹
📊 Here are the key points for a potential trading opportunity in NZDCAD:
1️⃣ The Daily Chart indicates a downtrend as the EMA 108 is below the SMA 169.
2️⃣ Our AI screener indicates that CAD strength has transitioned from the weak side to the strong side since October 19, 2023.
3️⃣ On the NZDCAD 8-hour chart, a Lower High has formed between the EMA 108 and SMA 169, filling the FVG (Fair Value Gap) that formed on October 23, 2023.
4️⃣ Last Friday, November 10, 2023, a BOS (Break of Structure) occurred after the AUDCAD also experienced a BOS.
5️⃣ This setup suggests a Short Swing trade strategy, targeting levels below: 0.8127, 0.8078, 0.80298, and 0.7981. There is still a possibility of reaching the FVG at 0.8012, given the overall downtrend on the Daily Chart.
6️⃣ Set a Stop Loss at 0.8176 to manage risk effectively.
7️⃣ The short entry zone is between 0.8130 and 0.8164.
8️⃣ Consider entering the short trade on an Hourly Chart retracement above 0.8078.
9️⃣ Aim for a minimum profit target of capturing 40 pips.
Keep a close eye on these levels and trends in NZDCAD for potential trading opportunities. Remember to manage your risk and trade responsibly!
✅ Stay tuned for more updates and analysis. Happy trading! 🚀💰

NzdCad... Long!I'm pulsive move, correction, impulsive move, correction... impulsive... You get the point!
I'm looking for a continuation to the upside on this pair... two targets... 85 pip profit potential.

Nzdcad potential sellThe trend is ur friend,..let's wait for nzdcad to give us signals for sell entry

NZDCAD LONG Market Structure Bullish on Higher Time Frames (Weekly Daily H4)
Weekly And Daily in the same AOI
Strong Weekly Bullish Close
Daily Rejection at AOI
Potential Daily EMA Retest
H4 EMA Retest
REMEMBER: Trading is a Game Of Probability
: Manage Your Risk
: Patience Pays
: Every Moment Is Unique
: Rinse, Wash, Repeat!
: Stay Hydrated
