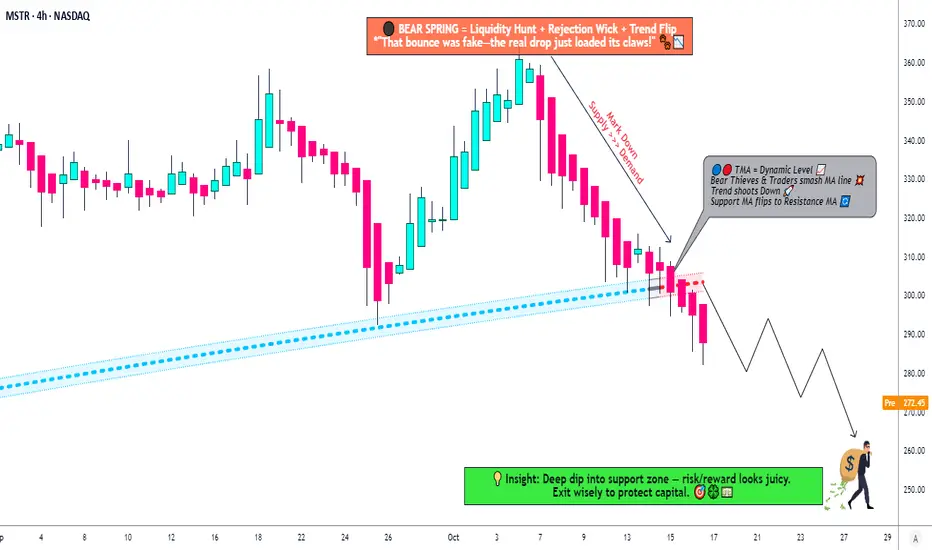
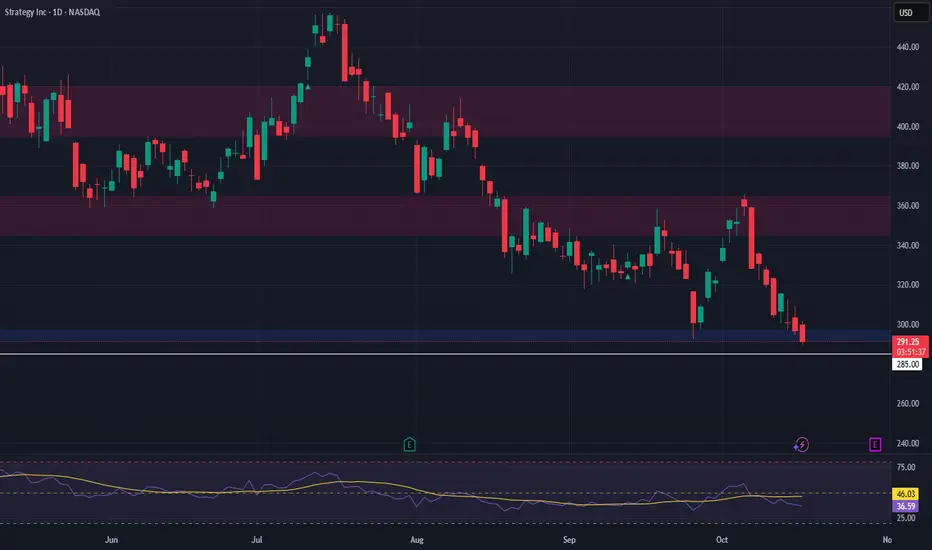
MSTR: Time to Short? Death Cross + Triangle Break Analysis🐻 MSTR "STRATEGY INC." - The Bear's Playground | Thief's Multi-Layer Setup 💰
📊 MARKET SNAPSHOT
Asset: NASDAQ:MSTR (Strategy Inc. - formerly MicroStrategy)
Current Price: ~$291.23 (Oct 17, 2025)
Setup Type: Swing/Day Trade - Bearish Confirmation
Strategy Style: "Thief Method" - Layered Limit Orders
Next report date
—
Report period
—
EPS estimate
—
Revenue estimate
—
14.99 USD
−1.17 B USD
463.46 M USD
263.40 M
About Strategy Inc
Sector
Industry
CEO
Phong Q. Le
Website
Headquarters
Vienna
Founded
1989
ISIN
US5949728530
FIGI
BBG01W930WV7
Strategy, Inc. engages in the provision of enterprise analytics and mobility software. The firm designs, develops, markets, and sells software platforms through licensing arrangements and cloud-based subscriptions and related services. Its product packages include Hyper. The company was founded by Michael J. Saylor and Sanjeev K. Bansal on November 17, 1989, and is headquartered in Vienna, VA.
Related stocks
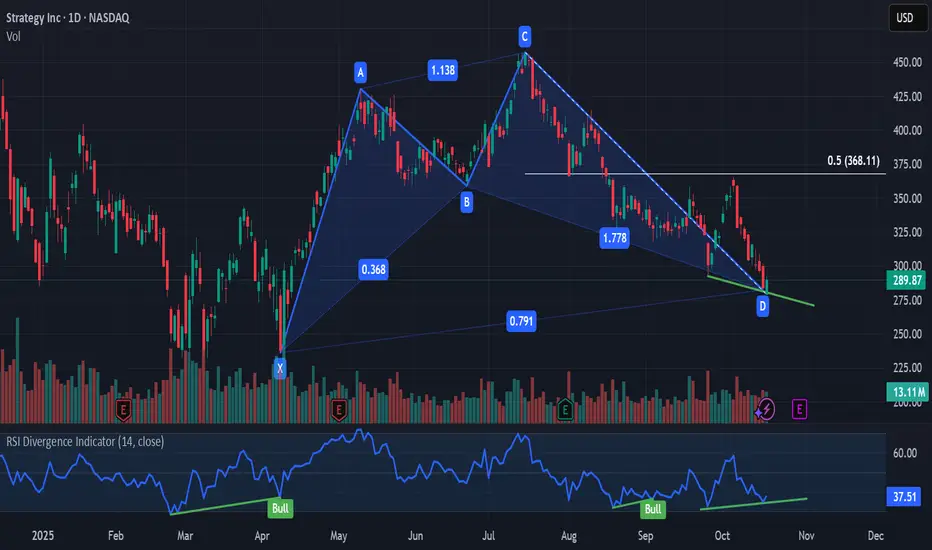
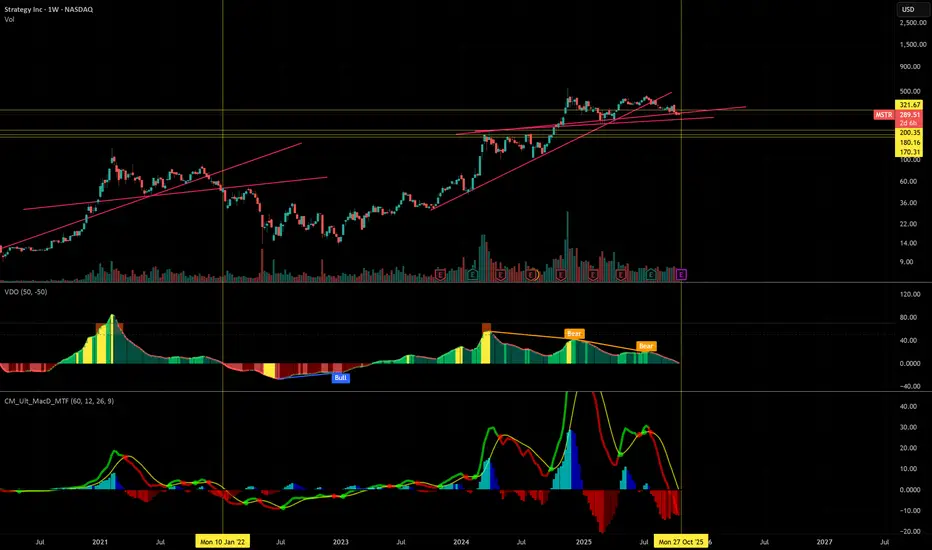
$MSTR bullish cypher patternBullish divergence on Cypher pattern PRZ with CRYPTOCAP:BTC currently trying to bounce during the weekend. possibly targeting 368.11
MSTR going lower before making the move upI am looking at NASDAQ:MSTR to make a lower move to a support zone which i see some orders at before moving higher. NASDAQ:MSTR movement has high correlation to $BTC. Seeing it go lower beofre moving up again.
MSTR : It's all about Dejavues'We had the almost exact behaviour before, but be aware that 20 Oct from BTCUSD Side there will be a intermediate low and year end rally of BTCUSD will start
MSTR: Trend ContinuesSince our last update, MSTR extended its sell-off. We still expect the low of this wave to form above the support level at $153.49. Once wave 2 is complete, we anticipate a strong wave 3 rally pushing above resistance at $674.18. Our alternative scenario assumes a different wave count: in this case,

MSTR- Double Bottom Forming at Key Support–Bullish Setup in PlayPrice is once again testing a major support zone ($292–$297), where it is also forming a double bottom pattern — a strong technical reversal signal. This confluence of structure and pattern typically suggests that bulls may soon regain control, setting the stage for a potential move higher.
💡 Trade
MSTR - legendary cypher Possibly going for final test of key trend line and historic S/R zone one more time... but who knows. Love the massive ascending triangle into ATH.

If this looks bullish.. you got another thing coming History doesn't repeat itself, but it often rhymes. So far 1:1.
I reckon the next 356 days will test out Saylors holders
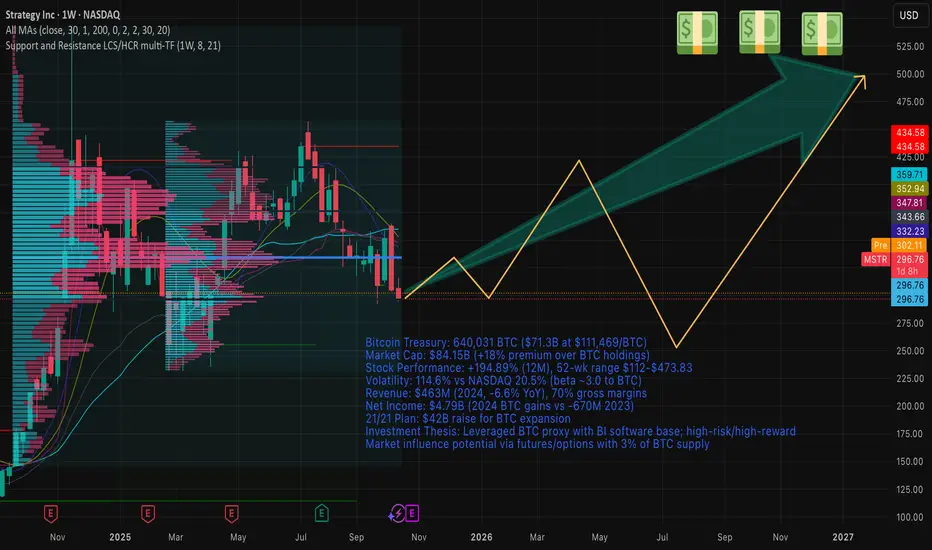
MSTR Hidden Leverage: What Happens When the Cycle Turns?When a company builds its balance sheet around Bitcoin, it becomes more than a software firm — it turns into a leveraged bet on BTC itself.
That’s exactly what MicroStrategy (MSTR) has done. And while this strategy paid off massively during Bitcoin’s uptrend, the same dynamic could become a serious
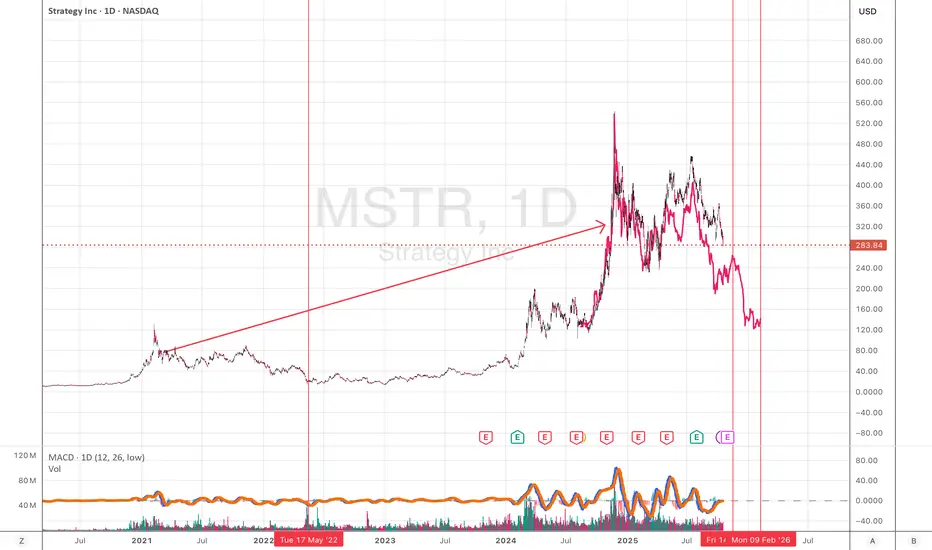
Strategy Inc. (NASDAQ: MSTR) - Financial ReportDate: October 16, 2025
Current Market Context:
As of October 16, 2025, Bitcoin trades at approximately $111,469 USD, reflecting a volatile yet upward trajectory influenced by institutional adoption and macroeconomic factors.
Strategy Inc., formerly MicroStrategy, holds 640,031 BTC, valued at $71
See all ideas
Summarizing what the indicators are suggesting.
Oscillators
Neutral
SellBuy
Strong sellStrong buy
Strong sellSellNeutralBuyStrong buy
Oscillators
Neutral
SellBuy
Strong sellStrong buy
Strong sellSellNeutralBuyStrong buy
Summary
Neutral
SellBuy
Strong sellStrong buy
Strong sellSellNeutralBuyStrong buy
Summary
Neutral
SellBuy
Strong sellStrong buy
Strong sellSellNeutralBuyStrong buy
Summary
Neutral
SellBuy
Strong sellStrong buy
Strong sellSellNeutralBuyStrong buy
Moving Averages
Neutral
SellBuy
Strong sellStrong buy
Strong sellSellNeutralBuyStrong buy
Moving Averages
Neutral
SellBuy
Strong sellStrong buy
Strong sellSellNeutralBuyStrong buy
MSTR6032672
Strategy Inc 0.625% 15-MAR-2030Yield to maturity
—
Maturity date
Mar 15, 2030
MSTR5946535
Strategy Inc 0.0% 01-DEC-2029Yield to maturity
—
Maturity date
Dec 1, 2029
MSTR6034213
Strategy Inc 0.875% 15-MAR-2031Yield to maturity
—
Maturity date
Mar 15, 2031
US594972AQ4
Strategy Inc 0.625% 15-SEP-2028Yield to maturity
—
Maturity date
Sep 15, 2028
US594972AT8
Strategy Inc 0.0% 01-MAR-2030Yield to maturity
—
Maturity date
Mar 1, 2030
US594972AR2
Strategy Inc 0.0% 01-DEC-2029Yield to maturity
—
Maturity date
Dec 1, 2029
US594972AN1
Strategy Inc 2.25% 15-JUN-2032Yield to maturity
—
Maturity date
Jun 15, 2032
See all STRC bonds
XPF
iShares S&P/TSX North American Preferred Stock Index ETF (CAD-Hedged) Trust UnitsWeight
1.07%
Market value
1.82 M
USD
FCIG
Fidelity Global Investment Grade Bond ETF Series L Trust UnitsWeight
0.00%
Market value
4.38 K
USD
Explore more ETFs
Curated watchlists where STRC is featured.


Frequently Asked Questions
The current price of STRC is 98.71 USD — it has increased by 0.02% in the past 24 hours. Watch Strategy Inc - Variable Rate Series A Perpetual Stretch Preferred Stock stock price performance more closely on the chart.
Depending on the exchange, the stock ticker may vary. For instance, on NASDAQ exchange Strategy Inc - Variable Rate Series A Perpetual Stretch Preferred Stock stocks are traded under the ticker STRC.
STRC stock has risen by 1.43% compared to the previous week, the month change is a 0.96% rise, over the last year Strategy Inc - Variable Rate Series A Perpetual Stretch Preferred Stock has showed a 11.54% increase.
STRC reached its all-time high on Oct 2, 2025 with the price of 100.00 USD, and its all-time low was 88.00 USD and was reached on Jul 25, 2025. View more price dynamics on STRC chart.
See other stocks reaching their highest and lowest prices.
See other stocks reaching their highest and lowest prices.
STRC stock is 0.29% volatile and has beta coefficient of 0.93. Track Strategy Inc - Variable Rate Series A Perpetual Stretch Preferred Stock stock price on the chart and check out the list of the most volatile stocks — is Strategy Inc - Variable Rate Series A Perpetual Stretch Preferred Stock there?
Today Strategy Inc - Variable Rate Series A Perpetual Stretch Preferred Stock has the market capitalization of 81.97 B, it has increased by 1.74% over the last week.
Yes, you can track Strategy Inc - Variable Rate Series A Perpetual Stretch Preferred Stock financials in yearly and quarterly reports right on TradingView.
Strategy Inc - Variable Rate Series A Perpetual Stretch Preferred Stock is going to release the next earnings report on Oct 30, 2025. Keep track of upcoming events with our Earnings Calendar.
STRC earnings for the last quarter are 32.60 USD per share, whereas the estimation was −0.10 USD resulting in a 33.25 K% surprise. The estimated earnings for the next quarter are −0.10 USD per share. See more details about Strategy Inc - Variable Rate Series A Perpetual Stretch Preferred Stock earnings.
Strategy Inc - Variable Rate Series A Perpetual Stretch Preferred Stock revenue for the last quarter amounts to 114.49 M USD, despite the estimated figure of 113.54 M USD. In the next quarter, revenue is expected to reach 116.65 M USD.
STRC net income for the last quarter is 10.02 B USD, while the quarter before that showed −4.22 B USD of net income which accounts for 337.61% change. Track more Strategy Inc - Variable Rate Series A Perpetual Stretch Preferred Stock financial stats to get the full picture.
Yes, STRC dividends are paid monthly. The last dividend per share was 0.85 USD. As of today, Dividend Yield (TTM)% is 0.00%. Tracking Strategy Inc - Variable Rate Series A Perpetual Stretch Preferred Stock dividends might help you take more informed decisions.
As of Oct 25, 2025, the company has 1.53 K employees. See our rating of the largest employees — is Strategy Inc - Variable Rate Series A Perpetual Stretch Preferred Stock on this list?
EBITDA measures a company's operating performance, its growth signifies an improvement in the efficiency of a company. Strategy Inc - Variable Rate Series A Perpetual Stretch Preferred Stock EBITDA is −26.12 M USD, and current EBITDA margin is −5.29%. See more stats in Strategy Inc - Variable Rate Series A Perpetual Stretch Preferred Stock financial statements.
Like other stocks, STRC shares are traded on stock exchanges, e.g. Nasdaq, Nyse, Euronext, and the easiest way to buy them is through an online stock broker. To do this, you need to open an account and follow a broker's procedures, then start trading. You can trade Strategy Inc - Variable Rate Series A Perpetual Stretch Preferred Stock stock right from TradingView charts — choose your broker and connect to your account.