UK100GBP trade ideas

UK 100 Short planDon't forget to click on the follow button after reading for more daily Professional analysis.
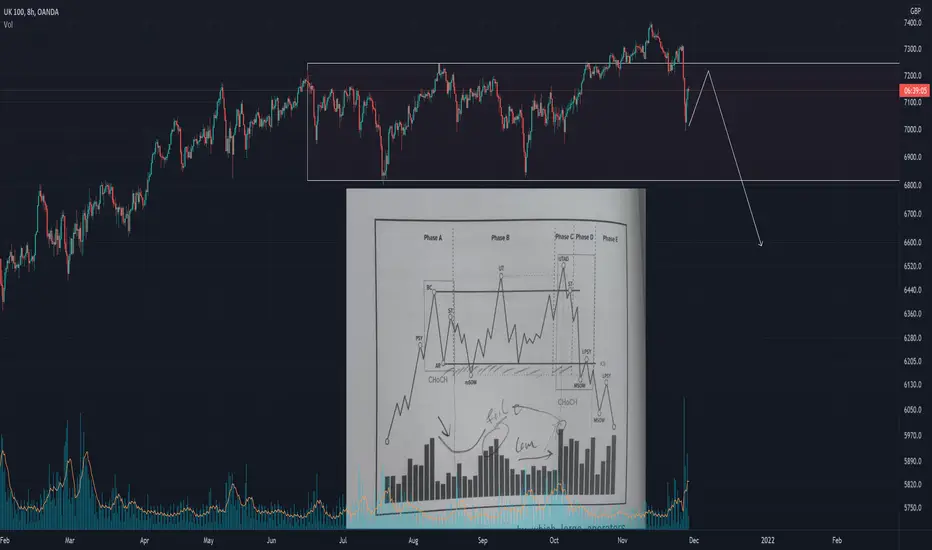
Here we have our UK 100 chart.
On the current rise, we are now looking to short back down to some key support and MA's, with our target identified with the directional arrow.

UK100 BULLISHlooking for a BUY positions after price fall down to close the Open Market Gap. price make a BOS, this is a sign that is posible to have a change of BIAS in this week


FTSE 100 (UKX) | The best area to fall🔥Hello traders, FTSE 100 (UKX) in daily timeframe , this analysis has been prepared in daily timeframe but has been published for a better view in 2 day timeframe.
According to the previous waves, this wave that we counted is wave b and wave b is formed in a zigzag pattern.
And we assume that this zigzag is over and wave c waves are formed.
We are inside wave 1 of wave c and wave 1 can be guessed to end at the bottom of the orange channel and wave 2 is formed as a reaction to this price floor and then wave 3 starts moving, which moves to 6500 in the first step.
This analysis is fielded if the previous ceiling is broken.
🙏If you have an idea that helps me provide a better analysis, I will be happy to write in the comments🙏
❤️Please, support this idea with a like and comment!❤️

FTSE intraday shortGood Morning, afternoon and evening traders! Don't forget to click the follow button after reading my post for more expert daily analysis.
Here we have our frequently traded FTSE 100 chart.
We are up on the day from current UK market sentiment attacking some key resistance.
We are looking for an intraday short this morning back down.

UK100 ready for a short!! (sunday at opening)Dear traders,
First of all, enjoy your weekend and have a great sunday.
Ofcoure our weekend is time to backtest and our sunday is used for preperation for the upcoming week.
1 trade that we are sure to trade, probably at open on Sunday, is the UK100.
This pair has shown an impulse downward move followed by a correction wich took a while.
This corrective move basically showing us that the bulls didnt find enough power to have the upperhand.
Bears are taking over.
As shown in our chart we can see that there was a counter-trendline wich held for a day, after it broke structure it retested and got rejected.
After the break of structure all the timeframes that we are interested in are aligning perfectly and we are ready to trade.
To wrap things up:
Sunday at open we will be interested in taking a short trade on the UK100 because of the indicators, timeframes and structure on these timeframes that align.
Wishing you an amazing trading week and stay safe!
Kind regards,
Tim.

Is the rally over? I'm optimisitic.....Leading on from my previous post where I got blew completely out of the water by the emergence of Omicron I am looking for a Reentry point for a climb back up. I should be clear that for the past weeks I have been shorting the Major indices to hedge/recoup my losses from the recent pullback. My emphasis is on the the word pullback.
I feel we are now seeing some good volume and stability about key levels. The US500 is finding traction around the 4500 level at present and the UK 100 is looking for buyers at 7100. On top of that the D200 EMA sits 60-70 points below and it looks like the big fish are seeing this as a huge buy opportunity. I still maintain that the FTSE is undervalued but the Fear factor is dominant at present. I am maintaing a position currently just above the D200 EMA and if we see a close around the 7100 level I will take a further position in anticipation of a possible bounce this week.
My rationale for the bounce is that I anticipate emerging data regarding the omicron variant over the weekend and my first impression are that this is potentially a high transmission/moderate pathogenicity variant at present. I admit this is a bit of a gamble and there is nothing more irrational than the financial markets but my bias at present is that this is pullback and a buying opportunity. God bless hedging....

UK 100 Bearish intradayFor more detailed analysis, don't forget to hit the like and follow button.
Here we have our UK 100 chart.
After our targets were hit yesterday we are now looking short for intraday gains.
We are already seeing some price rejection at recent 1H highs and looking for this to continue.

UKX 6796 targetI'm shorting UKX
This is the action-reaction technique aka market Geometry
We have a geometric target around 6800
Some bearish divergence is building on the weekly
POST FOR INFORMATION ONLY
No advice give

FTSE 100 intradayFor more daily detailed analysis from myself, don't forget to click on the follow button.
Along with other important markets, the FTSE is seeing some sideways movement over current market indecision.
Often at these times, price will move either way eventually.
Price direction is noted by the arrow.

UKX Hourly - Bounce feeling tad overdone here Bounced nicely as expected but has run a little too hard out the gates for my liking. Up against lateral resistance and hidden bearish RSI divergence confirms. Would like to see 7090 area re-tested

UK100 BullrunYou see ittt. W currently forming, price bounced off bottom of UPTREND. About to break resistance and take off for a cool 3000 point move. HIGH RISK TRADE.
Got to risk it for the biscuit.
I caught a thousand point drop off a ascending wedge. Price dropped a total of 2000 points before rising. Charts are looking right these days. Make your profits fam. Abundance.
(this trade will only be valid IF price breaks resistance. High probability that it will tonight or tomorrow morning.

UK 100 PlanDon't forget to click the follow button to get detailed daily analysis,
Here we have our UK 100 (FTSE) chart.
This is an asset I trade daily.
With the current news sentiment we have seen a fast and sharp move down followed by a swift rebound. we are at Key MA's and some good support.
We are looking to get long again. TGT area is noted by the Blue arrow on the chart.

WIll the FTSE go down to 4000?Hi All
With global pandemics continuing, inflation on the horizon, and the chart in a squeeze pattern at the 78.6% retrace - I think if the channel is broken and long term diagonal trend line heading upwards is also broken, then 4000 is a definite target.
I've been waiting all year, and i think it may happen soon
Good luck and safe trading.
Duncan

UKX Hourly - Good RR for a small longRsi divergence coupled with some long tailed candles. Small long targetting 7085.. Stop at the todays lows

UK-100 waiting for longNext Covid mutant creates a situation for us to buy the UK100 when reaches key levels. Usually it corrects 10-13% and/or around 20%. When it corrected 20% it always went intantly up. So when it reaches the instant buy zone it is a strong buy. Advice when to buy: it will make its final LL, then everytime it creates a HL it is the beginning of the uptrend.

UKX Hourly - Decent RR for a bounce I think theres a decent RR on offer here for a small long... stop at this mornings lows. Targeting 7140, 7155 and 7180

FTSE 100 Huge move..To make sure you never miss more detailed daily analysis from myself, Please feel free to click the follow button!
Here we have our FTSE or UK 100 chart,
Today we had a huge drop down. We are now RE buying on this fall at these great buy zones.
You can see the FTSE starting to pull away from this area. Price rejection is always a good sign that an area is great for buying power and we too should go long.
We are looking to hit the target higher up, noted by our directional arrow.

UK100GBPas i said yesterday but my first trade ended up loss and i managed a second trade as it was shawing all my strategies
pull back and small correction entry

Retest of S+D completed. Continuation underwayTechnicals:
As anticipated in my previous post, the retest of the S+D Zone around our 20 year channel has been completed (with a little help from the D50EMA) and we are now trading back above all major moving averages. My Short bias is back up to 7400 and likely onwards from there in the medium term. There is still a significant possibility of a retest of the 4H50EMA at 7285 and I suspect we will see that tomorrow morning on the open.
Fundamentals:
The elephant in the room is of course the spreading COVID wave across Europe at present (Have distanced myself from the DAX). The big wigs have been quick to distance the UK from potential ramifications at present and the statistics are still 'favourable' in my opinion. I suspect we may see more of a shift of liquidity from mainland Europe and into the US markets (US500 isn't done yet!) and I feel the FTSE will see some of this also.
Yellow line is my current average which I will likely scale to track the 4h50ema following a retest.
Trade Safe!

FTSE/UK 100 PLANFor more detailed expert daily analysis, don't forget to click the follow button.
Here we have our UK 100 or FTSE 100 chart.
Lots of news on today so we are expecting some larger movement.
As you can see with the eclipse symbol we have seen great price rejection around the 7210-7125 area.
We are now getting nearer to short positions on the day and will re long nearer this area as price falls lower.
Our directional arrows show us the movement of price.
