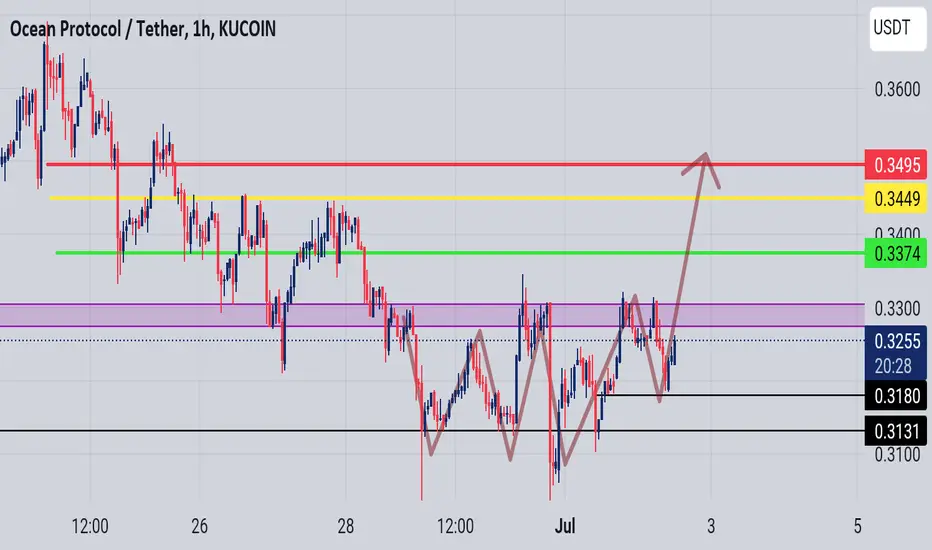
Bullish Ocean ProtocolOcean protocol create a bullish pattern, enter after breakout.. Target 0.35cent... Traill your stop loss
OCEANUSDT trade ideas
$ocean bidding 200 ema with stop tad under yellow
targeting VWAP from high and then see .. .4820ish
could long here but recon corn dips to 29250ish

OCEANUSDT OCEANUSDT is in strong bullish momentum and seems like it is on the verge of breakout from resistance around 0.3720 region. If the instrument close above 03720 area , it will be nice buying option.

Ocean above MA200 on daily time frame Ocean above MA200 on daily time frame And if the price can break the indicated resistance and reach the specified price, it has the ability to move upwards and grow well until the next resistance. BINANCE:OCEANUSDT.P

OCEAN has a lot possibles for bul lrunAfter an impulsive fall, the coin came to the buying zone of major players, after that, at increased volumes, it gave an upward reaction. At the moment, a triangle is being traded inside the figure, I have tested the lower border, I also observe the reaction. I expect an impulsive exit up, after the triangle retest I will take a long position, with the aim of going above the last peak and continuing the upward movement.

OCEANUSDTOcean lost an important support and was then supported by the uptrend line as well as the $0.25 support line. It is expected that the price will return to the previous support line, which has now become a resistance, and the price will fall again
⚠️ "Daily crypto market analyses I provide are personal opinions & not financial advice. Trading carries risks, so do your own research & seek advisor's help."

Ocean can go very deep, as they say!Looks like a classic distribution phase is going to happen. Not only on 4hr TF but also can be on weekly. If it plays out in weekly, the target will be even lower.

Surfing the High Tides: A Detailed Analysis of OCEANThe cryptocurrency market is no stranger to volatility. The past 24 hours has seen Ocean Protocol (OCEAN), a blockchain-based ecosystem that allows sharing and selling of data services, rise by approximately 20%. This significant move makes OCEAN one of the noteworthy performers in the crypto market today. But, as experienced traders know, what goes up can also come down. Let's delve into some technical analysis to decipher what these movements mean and what might be on the horizon for OCEAN.
Using the one-hour chart for our analysis, we're seeing some interesting dynamics at play. The zero Fibonacci level is coming in at 0.3264, with the half-level touching at 0.3407, and the first level peaking at 0.355. The Fibonacci retracement levels are key markers used by traders to identify potential levels of support and resistance.
In the short-term, we're seeing the upper Bollinger band at 0.3414, the middle at 0.3339, and the lower one indicating 0.3260. Bollinger bands are used to gauge volatility and price levels that are potentially overbought or oversold.
A look at the RSI (Relative Strength Index) shows a reading of 63, suggesting that OCEAN is neither in overbought nor oversold territory. This indicator can often signal potential reversals when it breaches levels of 30 (oversold) and 70 (overbought).
Delving deeper into volume analysis, we see the OBV (On-Balance Volume) indicator is showing a significant 526 million. The OBV provides us with a cumulative total of volume adjusted depending on price movements. It can be a useful tool to confirm the strength of a trend, with rising OBV typically supporting an ongoing bullish trend.
Moreover, the MACD (Moving Average Convergence Divergence), a trend-following momentum indicator, stands at 0.0077, confirming the current bullish bias.
The EMA (Exponential Moving Average) with a length of 50, currently at 0.3161, serves as a dynamic level of support or resistance and indicates the overall trend direction. As the price remains above the EMA, it can be considered a bullish sign.
Shifting the analysis to a four-hour time frame, the zero level of Fibonacci is indicating 0.3558, the middle Fibonacci level is 0.2983, and the first level is 0.2408. This analysis offers a broader perspective on the price action, reaffirming the upward momentum.
To conclude, the current indicators suggest continued bullish pressure for OCEAN. But, given the inherent unpredictability of the cryptocurrency market, these signals should be used as part of a more comprehensive trading strategy. Traders should stay alert to market changes and adapt their strategies accordingly. Always remember, in the world of cryptocurrency, education and vigilance are your most trusted allies. Happy trading!

Don't miss this opportunityhello guys
as you can see the dynamic trendline has been broken and if the 1.618 fib will broke you can open a long position
The information provided on this Page does not constitute investment advice, financial advice, trading advice, or any other sort of advice and you should not treat any of the website's content as such. this page does not recommend that any cryptocurrency should be bought, sold, or held by you. Do conduct your own due diligence and consult your financial advisor before making any investment decisio


OCEAN further down after backtest of 4 months tradingszoneTiming entry after markdown.
0.315 level was critical support range from the past.
A backtest to this level would be ideal entry or a pierce into with quick rejection.

LONG OCEANUSDT 09.06.23 {ENGLISH}1W:
Large buyers volume (bulls)
Bullish MA cross (bulls)
Bearish divergence on a/d (bears)
Fear and Greed Index:
50 (neutral)
General mood in the market:
Trading Range (neutral)
Reason for opening a deal:
Medium-term deal (several months). Bullish trend is clearly visible on the chart, now we are at the estimated minimum of its correction of 50% (the lower zone of the flag). Usually such a situation is a good opportunity to buy before resuming the upward movement + very good profit/risk ratio.
Instructions for action: Cancellation of a position after 1 closing under the flag.
Trading Strategy:
Purchase: at 0.302
Stop-loss: 0.267 (-11.6%)
Take-profit: 1.085 (+259.27%)
Profit/risk: 22.35

OCEANUSDTCup and Handle patter, will ocean flows to ATH if break the pattern?
or Ocean only retest to continue falling like waterfall

Ocean Protocol - The escape Ocean yesterday when bitcoin decided to drop landed in some deep resistance unfortunately and is slowly working its way out (color brown) expect once its above it'll go back to flying :) MACD impulse has crossed Signal on 1 hr chart so it's a good bullish sign if Bitcoin can stay green then all's well right :)

A nice Buy setup for OCEAN/USDT OCEAN/USDT is on a nice support zone and there was a long wick rejection, i'll be going in for a buy once i see more confirmation, but we already have a bullish engulfing though.


OCEANUSDT responds well to trend linesHello everyone. Today, the market has arranged for us a red day in the calendar. Everyone was already ready to fly, but somehow not so. And this is not surprising, in the style of the crypto market. Nevertheless, the mood is still set for a long time, since the news background for the crypt is quite positive, and many charts/news indicate that the cryptocurrency has reached its lows. Well, today we will consider OCEANUSDT, which responds well to channels and support lines. During the correction, a good option appeared to enter with a goal of at least 0.4. In general, the coin shows a positive trend. Therefore, they should go higher from the current support.

OCEANUSDT possible pumpPossible breakout on D1. Bounced of 0.3 2 times. Big Data project so this might be a good choice since AI stocks are pumping.
SL at 0.2668. Plan to hold it until alt season.
Still, price depends on BTC moves, so this one might dump as well.

OCEANUSDT trading inside resistance zone, retrace likelyThe price was trending well to the upside. But now it has hit the resistance and trading inside the resistance zone. It may break out to the upside but the probability does not favor that and therefore a long is not favorable. I expect a push back to the downside here. Let us see how it goes. Long will be favorable on dip to the 4h or daily support below. Or if it breaks out to the upside conclusively.

OCEAN BEARISH IDEA potential bearish entry
Dow Theory in Place: Lower High and Lower Low Expected in Place
The Price was rejected from resistance, the rising wedge pattern coupled with bearish divergence (a bearish reversal pattern).
The bullish trend is still intact; (be careful with your levels)
Entry, SL, and TP levels are defined.

OCEAN aim to 0.55!Day time frame
-
OCEAN just broke out this triangle structure with good momentum.
Next, wait it to retest the structure, then there is a good timing to open long.
Target: 0.55, 0.65
SL: 0.283

ocean retestocean is set up to bounce of the trendline for a retest and regain of strength if the bounce is confirmed long position i will update with targets

#OCEAN BREAKOUT! GETTING READY FOR 80% PUMP!Good day to all. Don't forget to support the idea with a like and follow if you like it.
#OCEAN/USDT Trade setup
OCEAN breakout this symmetrical triangle pattern and currently retesting it according to this pattern we can expect some good bounce if every things goes good.
(Basic knowledge)
A symmetrical triangle is a chart pattern characterized by two converging trend lines connecting a series of sequential peaks and troughs. These trend lines should be converging at a roughly equal slope. Trend lines that are converging at unequal slopes are referred to as a rising wedge, falling wedge, ascending triangle, or descending triangle.
KEY TAKEAWAYS
Symmetrical triangles occur when a security's price is consolidating in a way that generates two converging trend lines with similar slopes.
The breakout or breakdown targets for a symmetrical triangle is equal to the distance between the initial high and low applied to the breakout or breakdown point.
Many traders use symmetrical triangles in conjunction with other forms of technical analysis that act as a confirmation.
Entry:- CMP
Target:- 50% to 80%
SL:- $0.365
This piece is not intended to be financial advice. Before making an investing choice, always do your own research and speak with a qualified advisor.
For more Quality Charts Analysis, follow us.
I'm grateful.
