OMGUSD trade ideas


Omisego broke out.Target of 7,93With this actual price is not a very attractive trade but if with a faint ,if bought around 3.60 is nice return trade.

A Breakdown OMG!I honestly have no idea what this coin is other than one with a funny name but it is among the high market cap cryptocurrencies so I put it in my Tradingview signals alerts for potential breakouts. While the other big coins have experiences a nice run up BITFINEX:OMGUSD has definitely lagged. Now it is setting up a rather clean breakout of a consolidation according to my metrics. If it breaks the consolidation it will also be breaking the 50% retracement of 3.2394 which is the halfway point of November's price action. This should trigger a retest of the bottom. So if a trader is looking to hedge a potential selloff in the space this would be my pick.

OMG/USD continuation to the upsideOmg just formed a beautiful ABCDE accumulation pattern.
If the resistance line is broken it is very likely a new wave to the upside is about to begin.
The post is for educational purpose only

OMG/USD Major Move PotentialMany times the most powerful moves are the result of strong technicals + strong fundamentals. Here on the chart you can see strong technicals suggesting major upside for OMG/USD. The chart appears to be in the early stages of a Wave 5 move upwards. Now, in terms of fundamentals, what could lead to such an explosive move? Well, put simply: Big Money. And perhaps this recent development and update is a sign of big money to come: the progress made on supporting Central Bank Digital Currencies (CBDCs).
www.youtube.com
omg.network
To the moon? Let's see.

OMG Short XABCD Bearish BAT 1. XABCD Bearish BAT Pattern in final CD move towards area shown in chart.
2. There is heavy historical resistance at this level too. Check the chart and draw your own resistance lines to confirm.
3. XABCD Bearish BAT Pattern confirms the heavy resistance possibility.
4. Make sure to set stop loss accordingly.
5. Speculative setup, please do your own analysis before trading.
6. I am not licensed to provide financial advice. Trade at your own risk!
If you like this please give a thumbs up and follow me!
Out -
WineTrader888


OMG Network (OMG) - October 24Hello?
Dear traders, nice to meet you.
"Like" is a huge force for me.
By "following" you can always get new information quickly.
Thank you for always supporting me.
-------------------------------------------------- -----
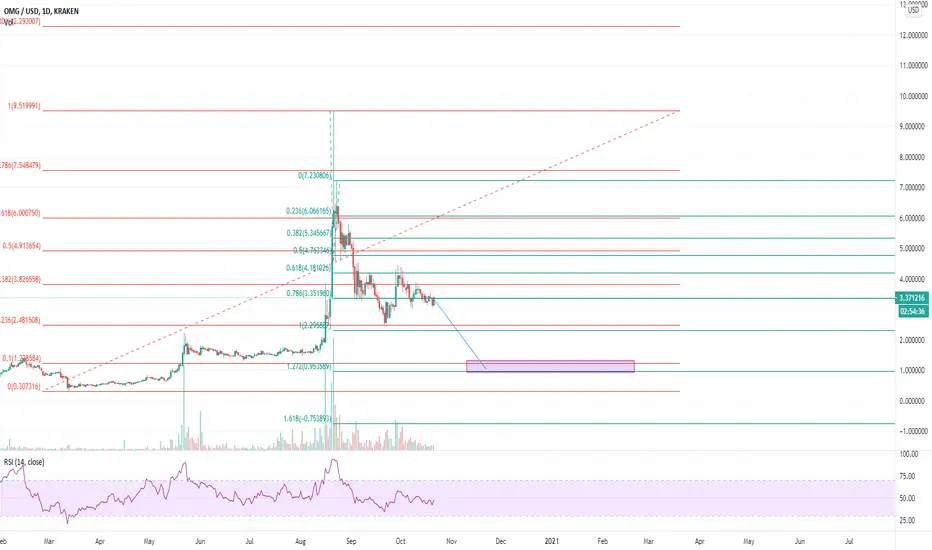
It rose with support at the uptrend line (3).
We have to see if we can ascend above the 3.6802 point.
A break above the uptrend line (4) is expected to touch the 5.0400 point.
If it falls from the uptrend line (3), it is likely to fall below the 2.75 point, so it is a short-term Stop Loss.
I think the 2.75 point or less is the bottom segment, that is, the mid- to long-term investment area.
-------------------------------------------------- -------------------------------------------
** Check support, resistance, and abbreviation points.
** Support or resistance is based on the closing price of the 1D chart.
** All explanations are for reference only and do not guarantee profit or loss on investment.
Explanation of abbreviations displayed on the chart
R: A point or section of resistance that requires a response to preserve profits
S-L: Stop-Loss point or section
S: A point or segment that can be bought for profit generation as a support point or segment
(Short-term Stop Loss can be said to be a point where profits and losses can be preserved or additionally entered through installment trading. You should trade from a short-term investment perspective.)

OMG on the verge of a technical breakout to $3.20 - $5.50OMG/USD recovers from support at $2.80 and ready to post gains towards $5.50.
The OMG Network plugged massively like other major and minor coins in the cryptocurrency market. The decline swept widely across the digital assets recently. OMG succumbed to the increased selling pressure leading to significant sabotage to the progress made in August. From the high traded in August at $9.50, At the time of writing, the crypto is trading at $2.90.

OMG/USD Long Good potential gains-Following good trend line
-Take your time it may take until the end of november to begin the rally. But hopefully sooner
Please comment your views

OMG pump again? Past year says soIn the past half a year OMG pumped a few times, the tops are usually 100-90 days apart.
As seen from the previous pumps, it moves fast, moves strong.
I expect a huge pump in the upcoming weeks, as omg continuous it's parabolic rise.


OMG Reversal Happening Now
hi traders:
OMGUSD is showing great price action for reversal up move.
We see price has been in this down trend since
mid August, and slowing push price down to the previous lows.
We then see price developed into this inverse Head and shoulder, had its LTF bullish push up and formed continuation correction.
Since price has already broken out, then good to look for LTF corrections to get in this buy move.
thank you

OMG in Review Good Morning to Those Who Sleep in Late
Just a quick review of OMG on this Canadian Thanksgiving weekend. So it looks like we can casually see that OMG has been on a gradual upwards movement each 90 days showing a nice 30% price increase during these periods and the angle of assent has been a somewhat reserved 22%. I believe we can see OMG continuing this pattern until the end of this month and then we can continue chart to year end.
The only thing we had to deal with was that rapid spike in price in Sept ( for no reason that I know of, although I haven't researched it) A spike like that is an anomaly and I don't take them into account when I am looking at a chart, because as you can see, they come back down just as fast as they went up. Straight up and then straight down is a "wash" in my books, so I ignored it and continued on after it came down to earth. Some traders like this type of action, as they can short the asset at the peak of the spike and buy back at the bottom, but all it does for me is to screw up my perception of an asset that is moving in a nice predictable upwards fashion.
I think or hope OMG will continue to trade in a sideways pattern and we will write a nice 45% profit for this 3 month period. Hopefully we will see yet another upwards movement and this will add to our data to help confirm this upwards "step pattern" we have seen in the past.
So in any event, if you have been holding OMG during this period you are "in the money" as they say. Above and beyond my two stable positions with BTC and ETH I hold a few positions in the more crazy market of ALT coins, that are in some way involved in addressing the ETH 2.0 problems. I happen to like LINK for this reason.
In closing, I'm looking forward to reading more of your posts and I will be sure to include a reference to them in my future postings....good or bad. Have a pleasant day and it would be interesting to know where you are located in the world when you post because I enjoy many of the different perspectives from various cultures around the world.
Ward Weaire
Toronto, Canada
Oct 12, 2020
6:52 AM

OMGUSD Long opportunityGood evening everyone. I hope you caught my link play, and were able to get out with a decent amount of profits. I am back with another play, this time featuring OMGUSD.
I have really enjoyed OMG these last couple of weeks. The wave structure is looking really clear, and it is a lot easier to read than some other coins like ETC.
Elliottwave analysis: If you've been following my omg posts, you know that we have just finished a larger term Tripple three correction, and are currently starting the wave three of the larger trend. The price action from the 21st of september tells me that the 1st and second wave of the larger term 3rd wave have been completed. If everything follows my t.a, we will be seeing some huge movements towards the upside in these next coming weeks.
Bitcoin has been making some really bullish moves, so I am going to take a very bullish standpoint on this trade. Something important to notice, is that the recent price action has been making a triangle formation and we are so close to breaking out of it. I don't believe that this is an elliottwave triangle, but instead, the classic technical analysis one. A break above means that we have a lot higher to go, and a break below might mean that it is just not yet time to move up. I plan on laddering into this trade, buying some right now, and more if we breakout.
All in all, this seems like a great trade and I hope you can get in.
Have a nice day.

OMG Network (OMG) - October 11Hello?
Hello, traders.
"Like" is a huge force for me.
By "following" you can always get new information quickly.
Thank you for always supporting me.
-------------------------------------------------- -----
If it falls below the downtrend line (5) or the uptrend line (3), it is a short-term Stop Loss.
We must see if we can ascend above the 3.6802 point.
It is possible to touch the 1.1550-2.75 section as a movement to create a new wave, so I think careful trading is necessary.
It remains to be seen if it can rise above the uptrend line (4) and boost expectations for an uptrend.
We believe that the point where we can expect further gains from the trend turnaround is at 5.7047.
Therefore, according to the flow of the chart, I think it is necessary to respond to some degree in the short term with split trading.
(1W chart)
Below the 1.1550 point, I think it is a long-term investment area as the bottom section.
The 1.1550-2.7500 section is a buffer section and a large'U' pattern is completed.
So, at 2.75, I think you must get support and climb to create a new wave.
Due to the nature of the coin market, there can be a lot of decline, so I think you should watch the buffer zone 1.1550-2.75.
As it broke through the 2.75 point, touched the 9.5 point and fell. I think I made a handle with a large'U' pattern.
-------------------------------------------------- -------------------------------------------
** Check support, resistance, and abbreviation points.
** Support or resistance is based on the closing price of the 1D chart.
** All explanations are for reference only and do not guarantee profit or loss on investment.
Explanation of abbreviations displayed on the chart
R: A point or section of resistance that requires a response to preserve profits
S-L: Stop-Loss point or section
S: A point or segment that can be bought for generating profit as a support point or segment
(Short-term Stop Loss can be said to be a point where profits and losses can be preserved or additionally entered through installment trading. You must trade from a short-term investment perspective.)

USD11 by Dec 2020; USD50 by 2022+Prediction for OMGUSD
This is in line when most exchanges starts using OMG as a L2 to help ease out ETH congestion, which Bitfinex has already done so, successfully!
All other ERC-20 tokens will also take advantage of it already. This makes OMG an essential Layer for ALTS Crypto market growth.
OMG has already started its bullish formation, and will trend upwards in weeks, months and years to come! this is only the beginning people.

Chart Taking Daily Percentage Increase Into Account 31 Days Fwd.Ok, well here is more conservative and fundamental approach to predicting a future price which calculates the daily percentage increase over the history of the chart, which is .63 % increase per day. This measurement eliminates the anomaly of the spike in price in Sept. which should not be included in our calculations.
Now if we extrapolate our percentage increase of .63 % per day, from today, for the next 31 days until we reach Nov 8, 2020, we arrive at a price of approx. $4.00 or an 18.9 % price increase. This falls in line with the 44 degree, upward trend line which must touch all three points to be valid.
Now personally, I would love to make 18.9 % every month on my money, especially if you reinvest it. Thoughts, opinions, ideas, criticisms ?
Ward Weaire
Toronto, Canada

Extrapolation of Price / Based on History of Peaks Good day chart lovers and those who believe they can forecast the future while the Gods laugh.
This is a rather simple analysis of OMG/USD since its inception where I have measured the time in days from peak to peak. Here is an approximate of those numbers. Period #1. 108 days Increase 31.8 % Period #2. 100 days Increase 25.8 % and Period #3. 100 days Increase 242.7 % Now period #3. is an anomaly, but I have left it in for this example, but will smooth it out for a later chart. When we do the averages we see that each period from high to high is approximately 100 days for a increase of 100% ( averaged out ) As you can see the 200 day MA is 18% angle upwards, slower than what I usually like to see, which is between 30 and 45 degrees.
So if we extrapolate out and upwards from the last peak, that puts us out at $12.40 price by around November 30th, 2020. Please note the log. price axis. Now this is a very basis analysis and I would like to see how it unfolds and I would love to see/hear from other traders who use more sophisticated technical analysis.
Have an interesting day and please remember your stop-losses, bull markets don't last forever and the intelligence of dollar cost averaging in both buy & selling.
Ward Weaire
Toronto, Canada

OMG following a downward trend Lately OMG's been matching the downward trend perfectly, using it as both support and resistance. We'll see what happens as we churn toward election day.

OMGUSD longer term idea Huge (10$?)Hi everyone, I am back with a quick update for two of my favourite coins. There will be a more in depth analysis, but right now I am super busy and I don't have time for a full write up, so here is the gist. What we saw on the 17th of august was the first wave up of the larger cycle. We finished our w,x,y,x,y,z correction, and as you saw from my most recent omg t.a we spiked up. I believe that this spike upwards was the first wave of a wave that is going to send us above the previous highs. Notice how the macd is floating around the zero line on the 4 hour. This is a sign that we are headed on our way up. I would be really careful at this time, to make sure that you don't hop in prematurely. Just watch, and I will keep you updated for a point of entry.
