oneusdtoneusdt may form butterfly harmonic pattern on 15minutes tiume frame .taregt and sl can be seen
ONEUSDT.P trade ideas

ONEONE coin is currently undergoing a correction phase, which typically involves a temporary decline in price within an overall upward trend. During this phase, the price might take corrective liquidity, where sell orders are triggered to allow for more buying opportunities. This action can push the price higher, indicating a potential for good investment opportunities. Corrections are a normal part of market movements and can offer strategic entry points for investors looking to capitalize on future growth.

Further downwardsThe current trend is downwards, and it's heading lower, with support. ONE is currently testing this support level. Additionally, there's a large descending channel, which could keep the price oscillating for a few weeks.
The bearish scenario suggests it might hunt its support and, with solid confirmations, move further downwards.

ONEUSDT fighting over two monthly levelsWe are in a fight between the levels of 0.019-ish zone (first monthly close) and 0.0226 (double monthly closes).
Nevertheless, I am looking at this context as a reclaim of support as the resistances (0.0226) were initially tested only last month and just now we have tested as a support and it is currently holding.
I am expecting higher prices from this month as we have only just started the month with a test in the huge support zone.
Invalidation will be a clear rejection of 0.0192.

ONEUSD 1WONE ~ Updated
#ONE Don't miss BINANCE:ONEUSD , Pump is coming soon. it's just a matter of time.

ONEUSDT IDEAHello Traders Hope You Are Enjoying Our Analysis. Today We Will Discuss About ONE
(Update)
Trying To Breakout Descending Channel On 12H Timeframe☑️
In Case Of Successful Breakout Expecting Massive Bullish Wave⚡️

ONE - Looking like a moon trade #ONE/USDT #Analysis
Description
---------------------------------------------------------------
+ The price has reached the broadening wedge pattern and is currently trading within the support zone.
+ I anticipate this support holding and the price rebounding from this zone. (However, if this support fails, our trade is invalidated.)
+ I'm initiating a short position at this point and will consider adding more once the rebound is confirmed.
---------------------------------------------------------------
VectorAlgo Trade Details
------------------------------
Entry Price: 0.01983
Stop Loss: 0.01595
------------------------------
Target 1: 0.02251
Target 2: 0.02560
Target 3: 0.03124
Target 4: 0.03931
------------------------------
Timeframe: 1D
Capital Risk: 1-2% of trading amount
Leverage: 5-10x
---------------------------------------------------------------
Enhance, Trade, Grow
---------------------------------------------------------------
Feel free to share your thoughts and insights.
Don't forget to like and follow us for more trading ideas and discussions.
Best Regards,
VectorAlgo

ONE Watch for a Short-Term BreakoutI will buy on a breakout because the trend line looks solid to me, it has been tested more than four times. I think a breakout would be a very good buying point. However, always use stop losses because it could also be a fakeout who knows? For now, I think the key levels are 0.0230 and 0.0255 as TPs.

ONEUSDT IDEAHello Trading view Family / Fellow Traders.
I hope you have used and benifited from the previous analysis .
In today trading session we are monitoring ONEUSDT for a buying opportunity,
ONEUSDT UPDATE
Breakout and retest of the Falling wedge Pattern has almost complete ,In 1D Timeframe✅
Now,Ready for good bullish wave 🚀 🚀 maximum chance to gain +50 profit💸 in coming days✴️

ONEUSD 1WONE ~ 1W
#ONE Retesting successful. Make purchases gradually from here, with a minimum target of 15%++

✨ ONEUSDT: Breakout from Descending Channel Signal📊 Chart Analysis :
The ONEUSDT daily chart shows a descending channel pattern, which is a bullish reversal signal when broken to the upside. The price has been contained within this downward-sloping channel since early April, and it is now approaching a breakout point.
- Resistance Level: The upper boundary of the descending channel around $0.0220.
- Potential Target: Upon a successful breakout, the measured move target is around $0.0320, indicating a potential upside of approximately 46%.
- Volume: An increase in volume on the breakout would confirm the strength of the move.
🔍 Technical Indicator Analysis :
Momentum:
- RSI: Mostly neutral across timeframes, indicating balanced momentum with a slight bullish bias in the mid-term (12h at 56.8).
Trend:
- ADX: Neutral across most timeframes, with a slight bullish bias in the long term (1w at 29), suggesting emerging trend strength.
- CCI: Bullish in the short term (1h at 100.4) but turns neutral or bearish in longer timeframes.
- Ichimoku: Bullish in the mid-term (6h to 12h) but remains bearish in the longer term (1d to 1w), indicating potential short-term upward movement.
- MACD: Bullish in the short term (1h) and mid-term (1d), with bearish signals in the longer term (3d to 1w).
Volatility:
- ATR: Low fluctuation in the short term, indicating stable price action, with high fluctuation expected in the longer term.
- Bollinger Bands: Neutral in the short term, high fluctuation in the long term, suggesting potential increased volatility.
Volume:
- ADI, OBV: Generally bearish in the short term, but turns bullish in the mid to long term, indicating accumulation.
- VWAP: Bullish in the short term, bearish in the longer term, highlighting mixed volume trends.
🔮 Prediction :
Short-term (1h - 4h): Expect bullish movement with short-term indicators pointing upwards.
Mid-term (6h - 12h): Continued bullish momentum likely as indicated by Ichimoku and MACD.
Long-term (3d - 1w): Caution is advised due to mixed signals and potential high volatility.
📝 Conclusion :
ONEUSDT is poised for a potential bullish breakout from its descending channel pattern. Short to mid-term indicators support an upward move, while longer-term indicators suggest caution due to potential volatility.
💡 Final Call :
- Watch for a breakout above $0.0220 with increased volume for confirmation.
- Monitor key support at $0.0170 and resistance at $0.0220.
- Prepare for potential volatility and manage risk appropriately.
- Remember, Patience is the key in trading.
🙏 Thank You :
Thank you for reading this analysis. Always conduct your own research (DYOR) and make informed trading decisions. Happy trading!
Tags: #TechnicalAnalysis #ONEUSDT #CryptoTrading #BullishBreakout #Cryptocurrency

oneusdtComment We are forming a contraction triangle of the current type with a powerful post-construction format with a minimum target of 0.063.
Note: the end of wave e has not yet been determined

oneusdtWe are forming a contraction triangle with a minimum target of 0.063
Note: the end of wave e has not yet been determined

ONEUSDT - Prepare for Short SetupOverall Bullish on Harmony ONEUSDT project.
I am expecting that ONE is at supply zone and will move towards demand zone
Key levels are defined with SL, TPs.
Strategy for Short setup due to following reason.
1) Price is in supply zone in Hourly Chart - Market looks for demand zone
2) Bearish divergence
3) Double Top (Reversal Pattern)

Alikze »» ONE | Wave 3 or C bullish scenarioAccording to the previous analysis, the currency of Harmony One reached its target. Currently, it is in the microwaves of rising wave 3, which can increase this wave to 0.063. to continue But in the higher time, it is expected that the started wave will return at least 100% of its previous wave to the area of $3.27. But in short-term goals, the specified supply areas can be considered as profit limits.
»»»«««»»»«««»»»«««
Please support this idea with a LIKE and COMMENT if you find it useful and Click "Follow" on our profile if you'd like these trade ideas delivered straight to your email in the future.
Thanks for your continued support.
Sincerely.❤️
»»»«««»»»«««»»»«««
»»»«««»»»«««»»»«««

Harmony (ONE)Harmony is a blockchain platform designed to facilitate the creation and use of decentralized applications. Harmony achieves scalability and increases the speed of transactions and block generation through the use of random state sharding. Random state sharding allows the network to split the database into smaller partitions called shards to reduce latency.
Anyway, It is clear that after ONE's harmonic pattern ended, an upward move started but lacked momentum. So, ONE went further down to accumulate momentum, and after did so, a strong upward wave started, and now it seems breaking the minor downtrend line too. Looking at the chart, it can be seen that ONE has a lot of room to rise. Let's see what happens.

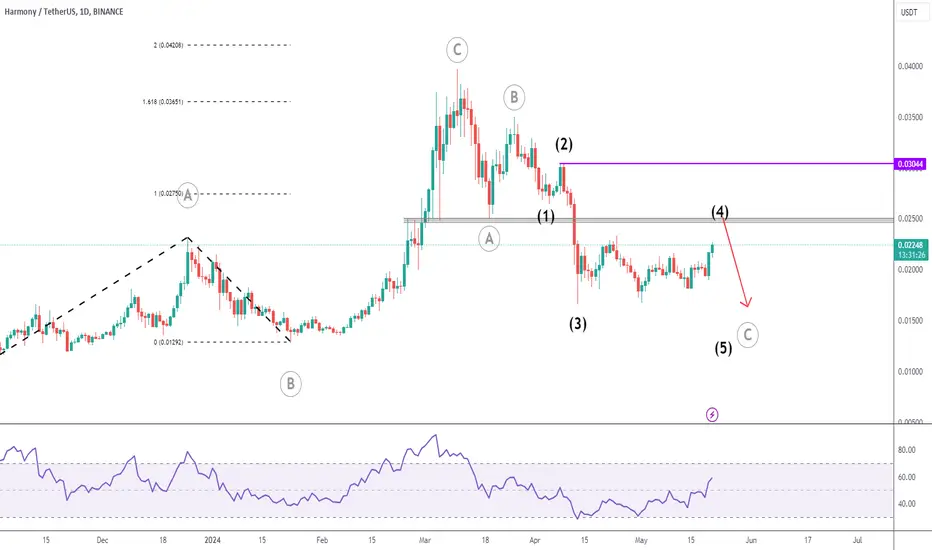
ONE Correction AnalysisAt the moment, I still don't see a clear bullish argument for ONE, even with the upside on the last few days.
My primary count considers we still have one more leg to the downside for black 5 / gray C.
There is a strong resistance level in 0.0250.
I'll consider we're bullish again if we break the purple level (at 0.0304).

ONE BUY Based on the provided chart for ONE/USDT on a 1-day timeframe from Binance, here's a detailed trading plan:
### Entry Point
- **Entry Zone**: Between 0.01877 and 0.02101 USDT
- This range represents a significant support zone where the price is likely to find buying interest. Entering within this zone maximizes the potential for an upward move while minimizing downside risk.
### Target (Take Profit) Levels
- **First Target (TP1)**: 0.02550 USDT
- This level is identified as the nearest resistance where the price might face selling pressure.
- **Second Target (TP2)**: 0.02816 USDT
- This level aligns with previous resistance and provides a reasonable medium-term target.
- **Third Target (TP3)**: 0.03108 USDT
- This level represents a higher resistance zone and aligns with historical price action.
- **Fourth Target (TP4)**: 0.03719 USDT
- This level is a long-term target and a significant resistance level, indicating substantial upside potential.
### Stop Loss
- **Stop Loss**: 0.01612 USDT
- This stop loss level is set below the support zone to protect against a deeper downside move. It helps in managing risk by limiting potential losses.
### Key Levels and Observations
- **Resistance Levels**:
- 0.02550 USDT (TP1)
- 0.02816 USDT (TP2)
- 0.03108 USDT (TP3)
- 0.03719 USDT (TP4)
- **Support Levels**:
- 0.02101 USDT (upper entry zone)
- 0.01877 USDT (lower entry zone)
### Technical Indicators
- **Volume Profile**: Shows high trading activity around the entry zone, suggesting strong interest and potential support.
- **Harmonic Pattern**: Indicates the potential price move based on the harmonic pattern, suggesting possible retracement levels and target zones.
- **RSI**: Currently around 48.76, which is neutral, indicating no extreme conditions (overbought or oversold).
- **MACD**: Shows a potential bullish crossover, suggesting increasing bullish momentum.
### Trade Plan Summary
1. **Enter** the trade within the 0.01877 to 0.02101 USDT range.
2. **Set Stop Loss** at 0.01612 USDT to manage risk.
3. **Target Levels**:
- **First Target (TP1)** at 0.02550 USDT.
- **Second Target (TP2)** at 0.02816 USDT.
- **Third Target (TP3)** at 0.03108 USDT.
- **Fourth Target (TP4)** at 0.03719 USDT.
Always remember to manage your risk appropriately and adjust your trade parameters based on market conditions. Use proper position sizing and consider overall market trends when making trading decisions.

ONEUSDT UPDATE #ONEUSDT
UPDATE
Hey dear traders hope you are enjoying trading and analysis with our team. we are here to discuss about ONEUSDT
ONE is making falling wedge. It has already breakout in 1D time frame ✍
Expecting 60 -70 %Profit in coming days 🚀

ONE/USDT It required break the pattern for continue movement!💎 Paradisers, #ONE is indeed a coin worth monitoring closely.
💎 Currently, it's traversing within a descending channel while also displaying a bullish reversal pattern known as a double bottom on the chart. Momentum seems to be building as the price approaches the resistance of the descending channel.
💎 For a bullish momentum to materialize, ONE must successfully break out of the descending channel pattern. A breakthrough would signal potential upward movement, with the next target being the resistance at the neckline of the double bottom pattern. Breaking this level would confirm increased bullish sentiment and could lead to a test of our target strong resistance area.
💎 However, if ONE fails to breach the neckline resistance, we might see a retracement to test the demand area or even a decline to the major demand zone.
💎 Should ONE fail to bounce from the demand area and instead break below it, the price could continue its downward trajectory toward the major demand zone.
💎 If ONE reaches the major demand area around 0.0176 - 0.016 in the future, it's crucial for it to bounce, as this level holds significant importance. Failure to do so would validate the bullish invalidation, potentially leading to further downward movement.
MyCryptoParadise
iFeel the success🌴

$ONE #Harmony Trading IdeaONE/USD (Harmony) is trading within a descending channel. There's a significant chance we'll see a retest at the top of the channel (resistance). While the price consolidates in the channel's mid. range, my next targets would be those 2 supply zones: $0.02195; $0.02590. Keep an eye on this channel.

Now is the good time to join into the ONE journeyOn my previous post, I have expected a gartley ending unto the price of 0.0226. It is a monthly level, previous range VAH and a fib 0.66. It had played out; although the dip had became the range's POC (around 0.0200). This marks the end of an ABC correction for its WAVE 3. We are set for a wave 5 which is highly probable that it will be extended, since both wave 1 and 3 has not extended.
This post is still in lieu with my ONEBTC chart posted months ago.
Invalidation will come if
April monthly closes below the price of 0.0226
At some point in May, we stay below 0.0226 and retested with a clear sign of rejection.
