OP Mega Bullish OP is looking very bullish. Because its swing structure was shifted and now we are looking for good entry after confirmation of internal structure shift. As we can see a clear CHoCH that is why I am looking to build long position around trendline retest and aslo there is my faviourite Fibb. level as

Optimism OP price has been moving in its own "special way"Today, NASDAQ:OP #Optimism has attracted attention because it is not falling in line with CRYPTOCAP:BTC and other altcoins.
In fact, for the past two weeks, the #OPUSDT price has been moving in its own "special way".
Perhaps there is already some fundamental news ready for this price movement

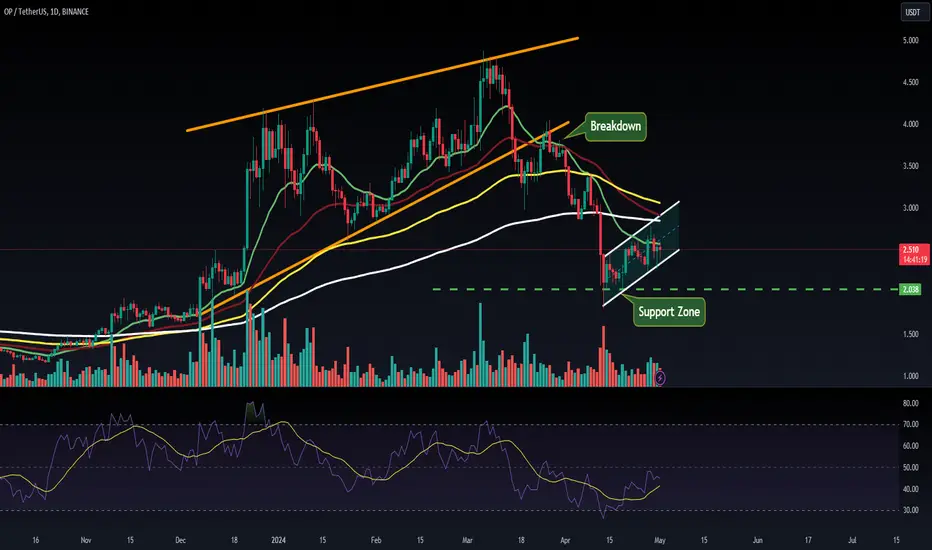
OP:b-b-e📊Analysis by AhmadArz:
🔍Entry: 2.487
🛑Stop Loss: 2.145
🎯Take Profit: 2.88 - .3.299 - 3.586
🔗"Uncover new opportunities in the world of cryptocurrencies with AhmadArz.
💡Join us on TradingView and expand your investment knowledge with our five years of experience in financial markets."
🚀Please boo

OPUSDT#OPUSDT
UPDATE
Trendline Breakout In 4H Timeframe✅
Incase Of Successful Breakout Expecting Massive Bullish Wave In Coming Days✍️

OP - Enjoy The Ride 🚗Hello TradingView Family / Fellow Traders. This is Richard, also known as theSignalyst.
📈 OP has been overall bullish, trading within the rising broadening wedge pattern in red.
Currently, OP is undergoing a correction phase and it is currently approaching the lower red trendline.
Moreover, it

OPUSDTOPUSDT was trading under the declining trendline. The price was reacting well the support and resistance of trendline
Currently the price has given the breakout from declining trendline with confluence to strong bullish divergence and now seems like the bulls are getting ready for some strong upside

#OP/USDT breaks Diagonal Trendline heading towards a FVG in 30-M#OP/USDT breaks Diagonal Trendline heading towards a FVG in 30-Minut TF!
I'm opening a long position with tight stop loss and entries are around that FVG.

OPUSDTmy entry on this trade idea is taken from a point of interest BELOW an inducement.. I extended my stoploss area to cover for the whole swing as price can target the liquidity there before going as i anticipate.. just a trade idea, not financial advise

OPUSDTDear Respected Traders, we hope this communication finds you well.
we are convening a discussion focused on #OPUSDT
#OPUSDT is forming a “decending channel”pattern in the “4” hr time frame.
Soon we will see a bullish move of “70 %”

OP TokenThe Optimism price retested its strong support mark of $2 and hovered in the bearish trajectory.
See all ideas