$IX with a bullish outlook following its earnings #Stocks$IX witThe PEAD projected a bullish outlook for $IX after a negative over reaction following its earnings release placing the stock in drift B with an expected accuracy of .
ORIX Corp.
No trades
Next report date
—
Report period
—
EPS estimate
—
Revenue estimate
—
2.66 USD
2.34 B USD
19.16 B USD
1.05 B
About ORIX Corporation
Sector
Industry
CEO
Hidetake Takahashi
Website
Headquarters
Tokyo
Founded
1964
IPO date
Apr 10, 1971
Identifiers
2
ISIN JP3200450009
ORIX Corp. engages in the provision of leasing and corporate financial services. It operates through the following segments: Corporate Financial Services, Maintenance Leasing, Real Estate, Investment and Operation, Retail, and Overseas Business. The Corporate Financial Services segment offers leasing and loans to small and medium-sized enterprises. The Maintenance Leasing segment consists of automobile leasing, car sharing, and equipment rental services. The Real Estate segment deals with property development, leasing, and facilities management. The Investment and Operation segment comprises of environment and energy-related business, loan servicing, and principal investments. The Retail segment offers life insurance, banking, and card loan services. The Overseas Business segment engages in financial services through overseas subsidiaries, business development and investment with business partners abroad, and aircraft and ship-related businesses. The company was founded on April 17, 1964 and is headquartered in Tokyo, Japan.
Related stocks
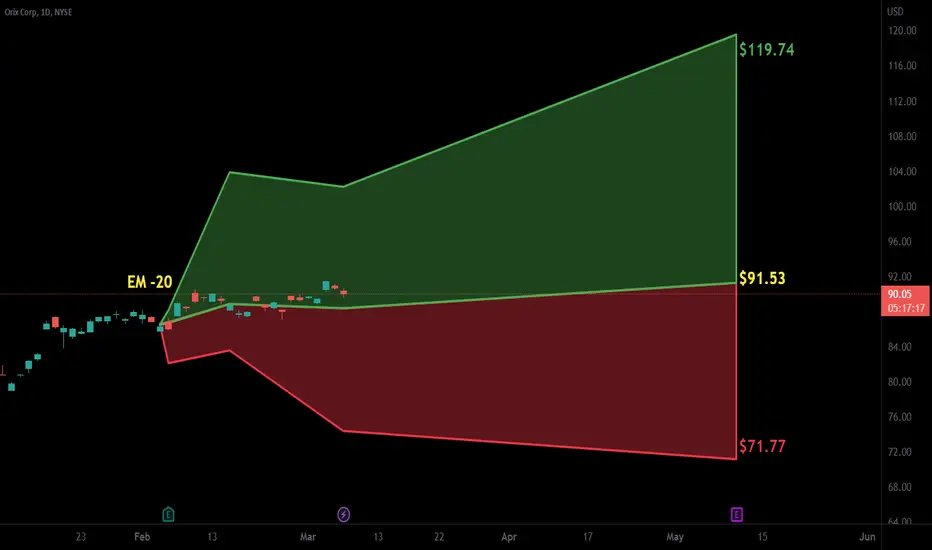
$IX with a Bullish outlook following its earnings #Stocks The PEAD projected a Bullish outlook for $IX after a Negative over reaction following its earnings release placing the stock in drift C.

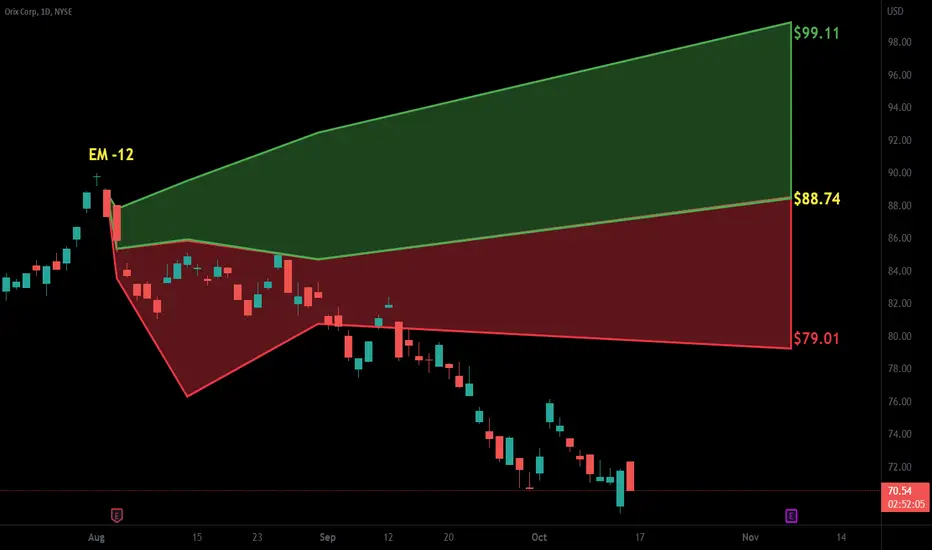
$IX with a Neutral outlook following its earnings #Stocks The PEAD projected a Neutral outlook for $IX after a Negative Under reaction following its earnings release placing the stock in drift D with an expected accuracy of 66.67%.
IX - Double Bottom RecoveryIX has formed a slight up channel
Within this up channel a strong bottom has formed
A second strong bottom is looking to form, that I have shown in bars pattern
This would make a double bottom and lead to further price increases
Bullish


See all ideas
Summarizing what the indicators are suggesting.
Neutral
SellBuy
Strong sellStrong buy
Strong sellSellNeutralBuyStrong buy
Neutral
SellBuy
Strong sellStrong buy
Strong sellSellNeutralBuyStrong buy
Neutral
SellBuy
Strong sellStrong buy
Strong sellSellNeutralBuyStrong buy
An aggregate view of professional's ratings.
Neutral
SellBuy
Strong sellStrong buy
Strong sellSellNeutralBuyStrong buy
Neutral
SellBuy
Strong sellStrong buy
Strong sellSellNeutralBuyStrong buy
Neutral
SellBuy
Strong sellStrong buy
Strong sellSellNeutralBuyStrong buy
Displays a symbol's price movements over previous years to identify recurring trends.
ORXC6009557
ORIX Corporation 5.4% 25-FEB-2035Yield to maturity
4.92%
Maturity date
Feb 25, 2035
ORXC5393620
ORIX Corporation 4.0% 13-APR-2032Yield to maturity
4.53%
Maturity date
Apr 13, 2032
ORXC5472117
ORIX Corporation 5.2% 13-SEP-2032Yield to maturity
4.51%
Maturity date
Sep 13, 2032
ORXC5142394
ORIX Corporation 2.25% 09-MAR-2031Yield to maturity
4.36%
Maturity date
Mar 9, 2031
ORXC6166051
ORIX Corporation 4.45% 09-SEP-2030Yield to maturity
4.33%
Maturity date
Sep 9, 2030
ORXC5885381
ORIX Corporation 4.65% 10-SEP-2029Yield to maturity
4.04%
Maturity date
Sep 10, 2029
US686330AJ06
ORIX Corporation 3.7% 18-JUL-2027Yield to maturity
4.02%
Maturity date
Jul 18, 2027
XS1527515321
ORIX Corporation 3.95% 19-JAN-2027Yield to maturity
3.99%
Maturity date
Jan 19, 2027
ORXC5472116
ORIX Corporation 5.0% 13-SEP-2027Yield to maturity
3.88%
Maturity date
Sep 13, 2027
XS291112200
ORIX Corporation 3.447% 22-OCT-2031Yield to maturity
3.32%
Maturity date
Oct 22, 2031
XS277046784
ORIX Corporation 3.78% 29-MAY-2029Yield to maturity
3.14%
Maturity date
May 29, 2029
See all ORXCF bonds
Frequently Asked Questions
The current price of ORXCF is 33.55 USD — it has increased by 3.22% in the past 24 hours. Watch ORIX Corp. stock price performance more closely on the chart.
Depending on the exchange, the stock ticker may vary. For instance, on OTC exchange ORIX Corp. stocks are traded under the ticker ORXCF.
ORXCF stock has risen by 10.73% compared to the previous week, the month change is a 12.91% rise, over the last year ORIX Corp. has showed a 52.50% increase.
We've gathered analysts' opinions on ORIX Corp. future price: according to them, ORXCF price has a max estimate of 34.97 USD and a min estimate of 25.90 USD. Watch ORXCF chart and read a more detailed ORIX Corp. stock forecast: see what analysts think of ORIX Corp. and suggest that you do with its stocks.
ORXCF reached its all-time high on Jan 7, 2008 with the price of 160.00 USD, and its all-time low was 10.10 USD and was reached on Mar 19, 2020. View more price dynamics on ORXCF chart.
See other stocks reaching their highest and lowest prices.
See other stocks reaching their highest and lowest prices.
ORXCF stock is 3.12% volatile and has beta coefficient of 0.97. Track ORIX Corp. stock price on the chart and check out the list of the most volatile stocks — is ORIX Corp. there?
Today ORIX Corp. has the market capitalization of 39.03 B, it has decreased by −1.34% over the last week.
Yes, you can track ORIX Corp. financials in yearly and quarterly reports right on TradingView.
ORIX Corp. is going to release the next earnings report on May 13, 2026. Keep track of upcoming events with our Earnings Calendar.
ORXCF earnings for the last quarter are 0.68 USD per share, whereas the estimation was 0.51 USD resulting in a 33.21% surprise. The estimated earnings for the next quarter are 0.52 USD per share. See more details about ORIX Corp. earnings.
ORIX Corp. revenue for the last quarter amounts to 5.39 B USD, despite the estimated figure of 4.41 B USD. In the next quarter, revenue is expected to reach 4.44 B USD.
ORXCF net income for the last quarter is 756.65 M USD, while the quarter before that showed 1.11 B USD of net income which accounts for −31.67% change. Track more ORIX Corp. financial stats to get the full picture.
ORIX Corp. dividend yield was 3.89% in 2024, and payout ratio reached 39.07%. The year before the numbers were 2.99% and 33.08% correspondingly. See high-dividend stocks and find more opportunities for your portfolio.
As of Feb 11, 2026, the company has 33.98 K employees. See our rating of the largest employees — is ORIX Corp. on this list?
EBITDA measures a company's operating performance, its growth signifies an improvement in the efficiency of a company. ORIX Corp. EBITDA is 6.65 B USD, and current EBITDA margin is 33.82%. See more stats in ORIX Corp. financial statements.
Like other stocks, ORXCF shares are traded on stock exchanges, e.g. Nasdaq, Nyse, Euronext, and the easiest way to buy them is through an online stock broker. To do this, you need to open an account and follow a broker's procedures, then start trading. You can trade ORIX Corp. stock right from TradingView charts — choose your broker and connect to your account.
Investing in stocks requires a comprehensive research: you should carefully study all the available data, e.g. company's financials, related news, and its technical analysis. So ORIX Corp. technincal analysis shows the strong buy rating today, and its 1 week rating is strong buy. Since market conditions are prone to changes, it's worth looking a bit further into the future — according to the 1 month rating ORIX Corp. stock shows the strong buy signal. See more of ORIX Corp. technicals for a more comprehensive analysis.
If you're still not sure, try looking for inspiration in our curated watchlists.
If you're still not sure, try looking for inspiration in our curated watchlists.