3rd graph - the robots manipulationrobots integrated to all platforms and fake players (YES, there is a central AI manipulating everything) buying and selling among themselves, moving prices in the desired direction
DJIAH2019 trade ideas

DJIA1! SHORTS 1HI'd like to say to everyone reading this hello! I like to draw symmetrical lines and uncover hidden meanings in their relationships. This is a chart of lines I have drawn. Sometimes I like to illustrate my drawings with icons. Historiclese ensures the historical accuracy of each drawing. I hope it speaks to you too!

ShortsI'd like to say to everyone reading this hello! I like to draw symmetrical lines and uncover hidden meanings in their relationships. This is a chart of ideas and things that I have drawn. I hope it helps!

DOW JONES 1DPreferably suitable for scalping and accurate as long as you enter carefully the price behavior with the drawn areas.
With your likes and comments, you give me enough energy to provide the best analysis on an ongoing basis.
And if you needed any analysis that was not on the page, you can ask me with a comment or a personal message..
Enjoy Trading... ;)

/ym #Technical analysis/ym trading at the monthly support zone.
support zone - 28700,27450,25247
resistance - 29700, 31800
Because of fed interest rate hike decision the market behaves choppy and neutral bear market.
should be more cautious for daily trading,
whereas buy the dip opportunity for long-term investment good returns over time.
This week trend may reverse from here for retracement. Short the rip for Traders.
Fomc minutes and cpi data this week lots of volatility.
Happy Trading!!!

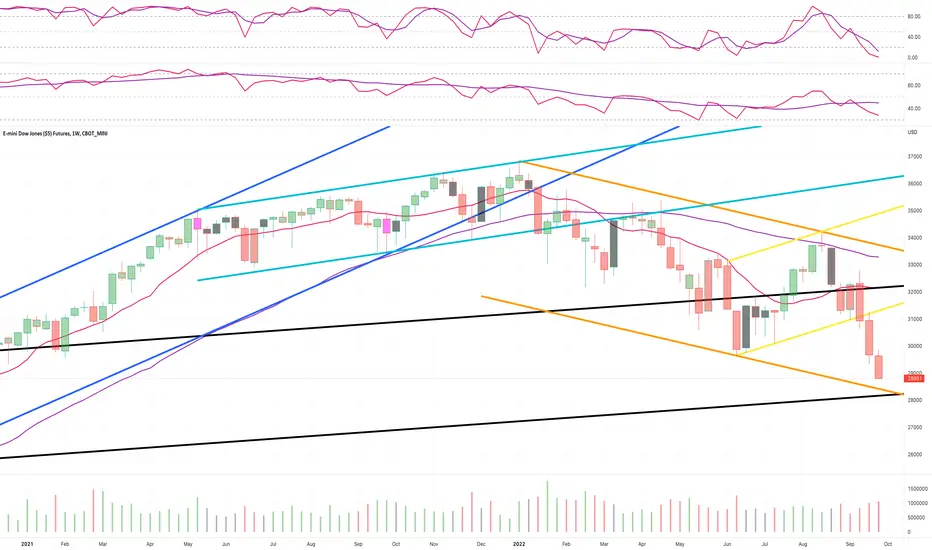
YM1! - Weekly Market Update, 10/10Dow futures have settled again below their June lows and are approaching ORANGE channel support.
Support and resistance structures have been adjusted accordingly for your reference.


Elliott Wave View: Dips in Dow Futures (YM) Might Find SupportDow Futures (YM) shows incomplete bearish sequence from 1.5.2022 high favoring further downside. The decline from 8.16.2022 high is in progress as a double three Elliott Wave structure. Down from 8.16.2022 high, wave A ended at 30975 and rally in wave B ended at 32789. Index extends lower again wave C towards 28635 which completed wave (W). Rally in wave (X) is currently in progress as a zigzag structure as the 60 minutes chart below shows.
Up from wave (W), wave ((i)) ended at 28974 and dips in wave ((ii)) ended at 28772. Index extends higher in wave ((iii)) towards 30399, and pullback in wave ((iv)) ended at 29933. Final leg higher wave ((v)) ended at 30513 which completed wave A. Wave B pullback is in play to correct cycle from 10.3.2022 low before the rally resumes. As far as pivot at 28646 low stays intact, expect dips to find support in 3, 7, or 11 swing for 1 more push higher to end wave C of (X). Afterwards, Index should resume the decline lower in wave (Y). Potential target lower is 100% – 161.8% Fibonacci extension from 1.5.2022 high at 22560 – 27022.

DOW 4HOUR : UP TREND WILL CONTINUE TO 31500dow is near buy area for hold to fibo61 ....under red arrow after PINBAR comes we can sell too but be careful from sell ..dow can go to 32800 trendline
good luck

YM1! US30USD DOW 2022 OCT 03
US30USD YM1! DOW 2022 OCT 03
Dow Scenario2 breakdown yielded 700pts for last week.
congrats to those who shorted.
Possible scenarios:
1) Short on rejection of trendline // 29639 // 28886
2) Prepare to long if round bottom is observed and market
retraces during an upward move and finds support.
3) Market rotates, then find trades at edge of rotation zone.
(Yellow box)
Price reaction levels
Short on Test and Reject | Long on Test and Accept
32789 31793 31385
31042 30636 30202
29639 29315
Weekly: Higher vol & narrower spread down bar, close off low
= minor demand
(ave vol on bar itself) = demand coming in
Daily: Ave vol down bar close off low = No Supply
H4: Vol showed buying on the downtrend. Coupled with possible
SPRING setup
Remember to like and follow if you find this useful.
Have a profitable week ahead.

YM1! - Weekly Market Update, 10/3Dow futures settled below the June lows this week and are likely headed for the lower $28,XXX handle in the coming week(s).
Potentially breaking down from there would accelerate a plunge towards the 2020 lows in the coming month(s).

$dowjones #futures #daytrading strategy , HOw to make MOney???I Use 1 minute Chart of Mini dow futures contract
the add #supertrend indicator + visibe range volume profile and you can use any occilator
$spx $ES_F $DJIA $DJ_F $COMPQ $QQQ $SPY

#tradingroom #daytrading #dowjones Strategy for futures $spy
How can we use simple indicators to trade??
How can we use simple indicators to trade??
I Use 1 minute Chart of Mini dow futures contract
#trendanalisys #chartpatterns #tradingview #trading #stocks #sp500 #stocktrading #dojones
#forex,#tradingroom,#daytrade,#daytrading,#dowjones,#nasdaq,s&p500,#trade,#nyse,#crypto

#daytrade #dowjones #initialjobless $DJIA $DJ_F Let's tradeHow can we use simple indicators to trade??
I Use 1 minute Chart of Mini dow futures contract
the add #supertrend indicator + visibe range volume profile and you can use any occilator
ASK ME FOR MORE.
#trendanalisys #chartpatterns #tradingview #trading #stocks #sp500 #stocktrading #dojones
#forex,#tradingroom,#daytrade,#daytrading,#dowjones,#nasdaq,s&p500,#trade,#nyse,#crypto

#trade #daytrading #DOWJONES #FUTURES Ym1! How to #germanycpiI Use 1 minute Chart of Mini dow futures contract
the add #supertrend indicator + visibe range volume profile and you can use any occilator
$spx $ES_F $DJIA $DJ_F $COMPQ $QQQ $SPY,
#trendanalisys #chartpatterns #tradingview #trading #stocks #sp500 #stocktrading #dojones
#forex,#tradingroom,#daytrade,#daytrading,#dowjones,#nasdaq,s&p500,#trade,#nyse,#crypto

Ym1! How to #trade #daytrading #DOWJONES #FUTURES $DJIA $DJ_FI Use 1 minute Chart of Mini dow futures contract
the add #supertrend indicator + visibe range volume profile and you can use any occilator
ASK ME FOR MORE.
#trendanalisys #chartpatterns #tradingview #trading #stocks #sp500 #stocktrading #dojones
#forex,#tradingroom,#daytrade,#daytrading,#dowjones,#nasdaq,s&p500,#trade,#nyse,#crypto
$spx $ES_F $DJIA $DJ_F $COMPQ $QQQ $SPY,

Dow futures dip below key levelBearish development on the DOW futures chart. A key level is the pre Covid crash high which was a bounce upwards in the last few sessions but today the price has dipped below this level again.

Ym1! How to #trade #daytrading #DOWJONES #FUTURES How can we use simple indicators to trade??
#trendanalisys #chartpatterns #tradingview #trading #stocks #sp500 #stocktrading #dojones
#forex,#tradingroom,#daytrade,#daytrading,#dowjones,#nasdaq,s&p500,#trade,#nyse,#crypto
$spx $ES_F $DJIA $DJ_F $COMPQ $QQQ $SPY,
I Use 1 minute Chart of Mini dow futures contract
the add #supertrend indicator + visibe range volume profile and you can use any occilator
ASK ME FOR MORE.

Ym1! How to trade #daytrading DOW JONES FUTURES How can we use simple indicators to trade??
I Use 1 minute Chart of Mini dow futures contract
the add #supertrend indicator + visibe range volume profile and you can use any #occilator
#trendanalisys #chartpatterns #tradingview #trading #stocks #sp500 #stocktrading #dojones
#forex,#tradingroom,#daytrade,#daytrading,#dowjones,#nasdaq,s&p500,#trade,#nyse,#crypto
$spx $ES_F $DJIA $DJ_F $COMPQ $QQQ $SPY

YM1! DAY TRADIN STRATEGYHow can we use simple indicators to trade??
I Use 1 minute Chart of Mini dow futures contract
the add #supertrade indicator
SIGN UP FOR ZOOM in REAL TIME
7:00 AM EST TIME
$spx $ES_F $DJIA $DJ_F $COMPQ $QQQ $SPY

A big down trend can accurehello
i guess that YM can have a huge bearish move in these 3 months, why and when we should keep this hypothisis?
- we are now into a black hole zone, if YM cannot break it up, we can hold our vision of free fall
- If the midline is broken fiercly we will have a nice confrmation
- the critical confirmation will take place if YM breaks down the green upchannel through its support
my targets are fonded on fibonacchi tools
good luck
NB: remeber dear traders that i do not have a cristall ball predicting future but we try to be more efficient and more rational in trading so your feedbacks are really important to encourage us and push as to do our best, if you like my analysis.

Dow emini stops@20% bear mkt with mma50 & GANN line supportDow e-mini officially entered bear market territory breaking below 20% decline limit & the weekly wma200 line. It is the only major index that made a lower low & confirmed by the transports DJT. Dow, with a lot of defensive stocks, has been holding the strongest all this time & I think it will be the last to capitulate before the market bottoms. (After market takes out the weak hands & stop losses)
However, it is still uptrend in the monthly chart with mma50 & my GANN line as support. It took only 7 weeks for it to drop 14% from the August top…exactly from 1 GANN line to the next one below. (Looks like a capitulation)
The moves this week will determine if current support will hold as Dow consolidates before the 4Q2022 rally up to December. (This may technically still be a double bottom…only a little below the 0.386 Fib retracement zone from pandemic low to ATH)
The monthly mma50 must hold to be bullish. Otherwise the next support will be the next GANN line below around the 27k to 28k zone…near the 0.50 Fib retracement zone.
Not trading advice
