Day Trade for COMI- ONLY if all stars are aligned.
- Resistance @ 75.70- 76.40, if the market is able to breakout these levels, high probability that CIB will at least poke 78.70.
- Day trading is highly risky, risk only what you can afford to lose.
- Bearish market cancels the trade.
CMGGF trade ideas

Possible harmonic patterns Two scenarios for bullish and bearish outlook are shown in the chart.
Wait for price action at potential reversal zone

COMI is Risky to buy or hold now- do your own research but I personally consider COMI a risk off.
- technicals are not in favor of a continuation.

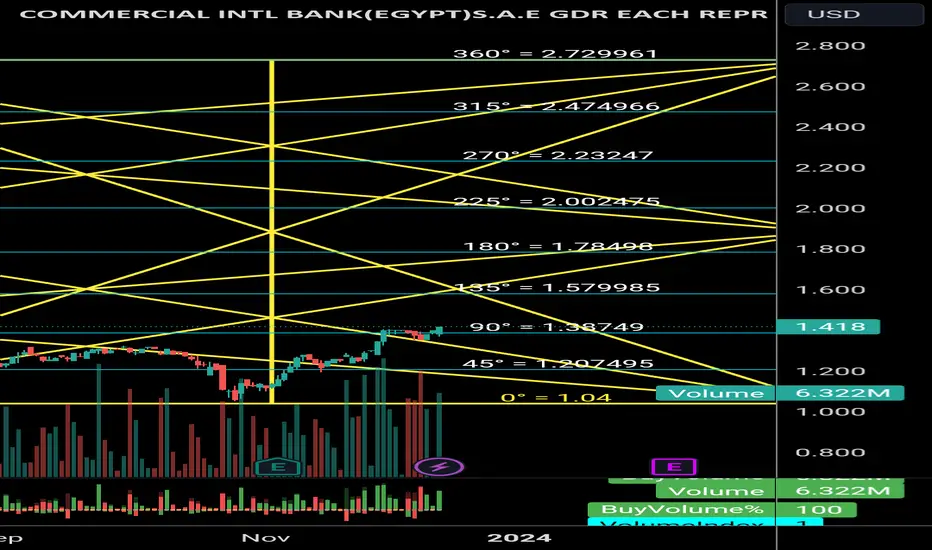
CbkdJinny gann star
Gann square of 9
Support and resistance levels
Possible top at 2.72
Support at 1.38
Good luck
Get on board Cib The aeroplane will fly to 100 next daysAs we can see after end of correction of Elliot waves, tomorrow will be critical for the target of 100egp

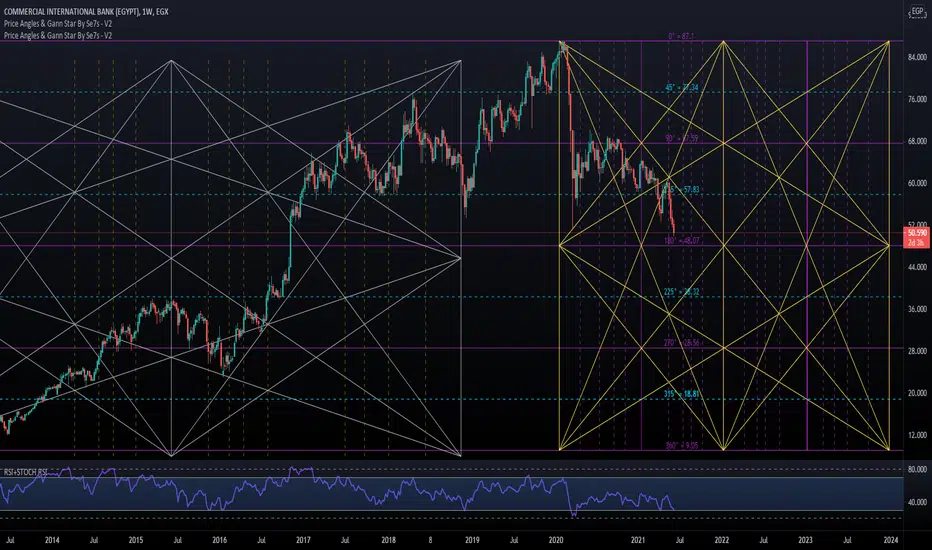
CIB to target 100Weekly chart, the stock is forming a parabolic pattern, to target 100 after crossing 87
BE CAREFUL: Stop loss level should be raised at every up movement.

CIB ??? LONG term ChartDOOOOM
LONG term...
support and resistance lines..
horizontal lines are Support/Resistance .
Vertical lines are time pivots .
Appreciate your Comments.
GL
COMI in rally leading the EGX 30the Commercial International Bank (COMI) is leading the EGX 30 with weight of 26.21% to a historical high points that was not been reached before. We can see from the chart that still having a potential rally after breaking the level of 58. However, the volumes is low and the rally to the uptrend is not as sharp as before. It is moving in an uptrend channel, not that perfect, but giving a close view in the short term.
It is expected to continue in it's direction reaching new levels around 75.
on the other hand, if the stock returned below the 58, it will fall dramatically to the next level around 47.5, and may continue to 40.
According to the economical data and the current situation in the region, specially the war in Gaza, we can not say that or predict the time that we can say that the EGX30 reached it's peak, so I recommend the investors to keep in consideration the risk ratio and distribute the portfolio on several stocks with a suitable risk management.

COMI, re-test 59.5 then target 70.3COMI, on the 30-min chart,
I see technical signs that the stock will go down to 59 - 59.5 , then turn up to target 70.3


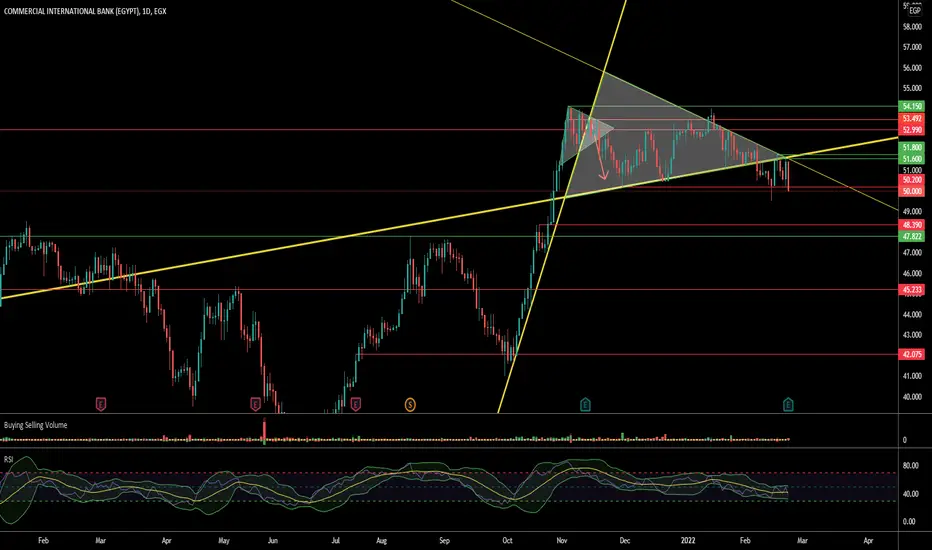
COMI, to target 58.5 in few weeksOn the daily chart, the stock COMI is trading in a channel, with a support level 47, and the target is 58.5 after crossing 53.
RSI and MACD techn. indicators are positive for uptrend.
A re-test at 51 - 51.5 is OK, before crossing up.
Stop loss should be considered.


Important Levels for Comi.Comi Closed Below 50.20 today, with a Bearish Engulfing candle.
Support Areas on the Chart:
1st Support : 47.78 - 48
Head and shoulders Is it going all the way down or the weekly trend will push it to newest publish level !!

Why Enter ? COMIWhy did I enter a buy @ 49.13 and why did I put my stop loss @ 47.13
1. On day 19th march the session ended up forming a doji, which is a clear sign that indicates a possible reversal in the trend. The doji forms its own resistance and support areas , which is indicated by its tails. This takes us to the second point,
2. The tail of doji formed a strong support area @47.13, which is the area that brought the price to it real body, this is a clear sign that if it have fallen there again, and broke it then the support was not strong enough to hold the new positive trend.

Possible Bullish (COMI) This is not a financial advice only an analysis
COMI is an uptrend as shown in the graph, and after 2 weeks of dropping in price a doji has appeared which may suggest a possible reversal in chart, as well as the CHOCH that you can see

A big corrective wave is comingFive bullish historical waves have been created, and we are at the end of a fifth wave, and three bearish corrective historical waves are in progress.

COMI London CBKDDear Friends,
Correction so far as long as its above 1.592 1.52
even if its going for the Bearish scenario, there is a trade up 1st to Form B >> Expect around 50 - .618% fib
So i am Bullish on Buying for a trade between 1.63 - 1.592 and will watch for the price action there for a confirmation.
On the Chart Fib Channel.
and Price points.
Good luck

Fake BearishTHIS IS NOT A FINANCIAL ADVICE, THIS IS ONLY A PERSONAL OPINION, WOULD LOVE TO HEAR YOURS IN THE COMMENTS
I believe this drop in price is only a correction due to the huge jump from 45 to 47.8. The price broken the trend line and is supposed to have a strong support @ 47.965 and 46.614. The final support before a bearish would be 43.04.
So to conclude i believe that if it continues above 43.04 , this is still a potential bullish sign.
Follow to stay updated

COMÍ Resistance and Support This is not a financial advice, but only a personal opinion
Since my last prediction and trend analysis was accurate thanks to god first,
I assume since it stabilized over the 50.834 which was the previous resistance, the next resistance will be @ 51.870 and possibly 52.491.
The stronger support is @ 49.382 and @ 47.96
Please follow and like if you would like to see more trend analysis and stock reviews

Bullish (COMI)BULLIISHHH
As you can see here the price has passed both resistance line @ 46.58 and @ 47.96 and stablized above them both, this means that it will have a new target of 50.87
THIS IS NOT AN INVESTING ADVICE, I AM ONLY SHARING MY THOUGHTS, AND WOULD LOVE TO HEAR YOURS EGX:COMI

COMI EGX30 Huorly chartThe Commercial International Bank, on the hourly curve, confirmed that there had been a reversal between the price movement and momentum, and retested the confirmation level at 43 Egyptian pounds, and the price is likely to reach the level of the demand area at 37.80-37.00

CIB-EGYPTThe trend for CIB Egypt weekly - The trend for CIB Egypt weekly - The trend for CIB Egypt weekly
