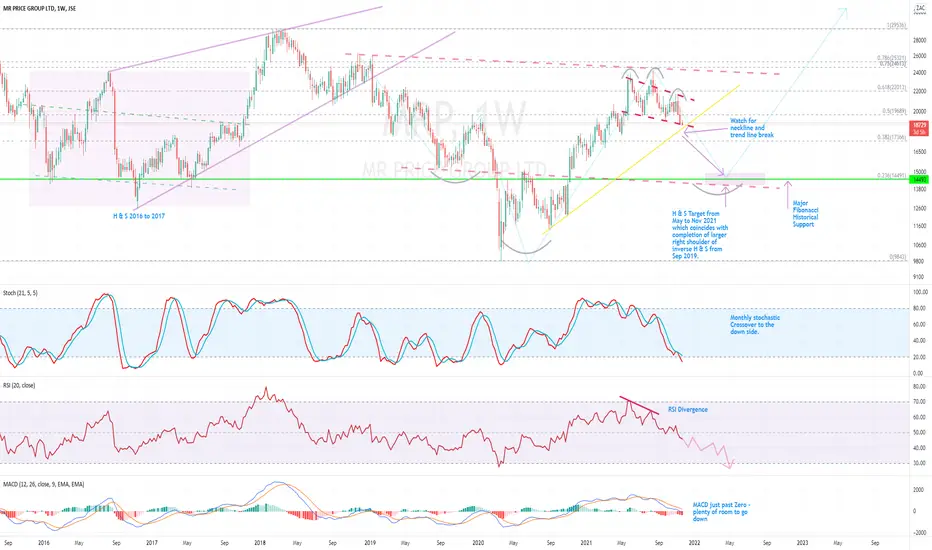
Long term Head and Shoulders idea to the down side.A major inverse H & S still to complete. Also a smaller more recent H & S that is possibly about to break the neck line. Monthly and weekly RSI Divergence. Weekly MACD has just past zero. Monthly Stochastic crossover to the down side. Rejection at 75% Fibonacci and break through the 50% and possibly on its way to the 38.2% all the way to 23,6% at about R140/R145 where all the technicals and indicators converge to that one point which incidentally copies another inverse H & S in Jan 2016 to June 2017 which ultimately failed through the ascending wedge formation. It seems that everything is pointing to the down side. This will be interesting to see how this pans out.
MRPLY trade ideas
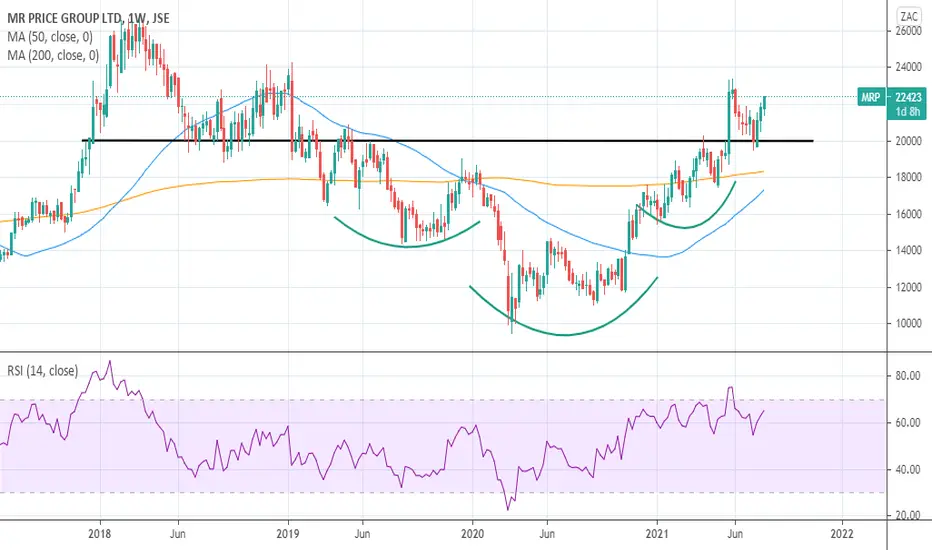
Mr PriceHead & Shoulder chart pattern still playing out on the weekly chart.
Initial breakout was in May 2021, we got a retest in July & Sept/Oct; and on both retest, neckline held as new support.
My medium-Long term target as guided by the chart, is 280-300.
But we can expect 240 in the short term.
*original idea below

MRP - 1D - Swing tradeMRP is nearing fairly recent bottoms, and also the 200 day moving average, Stochastics are oversold and i am putting in a short stop loss as there could be a possible double top in the making. Figures were good and i think xmas sales will only bode well for them.

MR PRICE - 200 Day Zone- After a rally reaching a high of R242.25 , price has pulled back to the 200 day moving average and previous breakout zone.
- Looking for bullish price action to build a swing long position.
-- MANAGE YOUR RISK - -
Disclaimer: All ideas are my opinion and should not be taken as financial advice.

Okay now its time for me to #BTFD Okay now its time for me to #BTFD. Mr Price holding support with strong fundamentals

Resistance BreakDespite the craziness currently in the market, MrP managed to break the downward resistance channel, hope it will be allowed to move up amidst all the noise.

BTFD The stock fell short a couple of percent of being in a bear market (-20% decline). However the uptrend support held yet again quite close to the 200 day EMA. Providing an opportunity to start building up a position with a tight initial stop loss just below the Thursday & Friday lows, but for a bit of room just below the 200 day EMA around R195. Providing an excellent short term risk reward trade with a R240 target.
If the stock above R204 I will rebuild my position with an initial stop loss at R195.70

MRP Range BrokenEntered a long trade last week which didn't take long to trigger my stop.
The channel MRP has been trading in has been broken to the downside.
After being stopped out long position has been changed into short. Current short target is around 16300.


MRP - 1D - EITHER ORThis could be a nice buying opportunity or further decline could confirm the double top. One to watch closely. Buying opportunities rare on the JSE lately.

Mr. PriceNeckline resistance broke, came for a re-test, and the move higher continues.
I'm still calling it 280-300.
This is a medium-long term play
JSE:MRP Markup looking to test R300MR Price has been in a strong markup after the base from the covid lows. The stock is stronger than the market. The pullback has been on lower volume and we are now ready for a test of historic highs at R300.


MR PRICE GROUPCLEAR UP TREND.
GOT TO POINT A HAD A BIT OF CONSIDATION.
THEY RE TEST POINT A VIA POINT B
SHOULD FINISH CONSILIDATION THEN CONTINUE UPWARDS

Mr Price Group - Approaching A Swing Long Mr Price Group (MRP) - Approaching A Swing Long
The share has retraced from it's medium term high of 23899c to having tested it's recent swing low of 19500c. As we have noted via a previous note, the gap close at 19950c was a target, which we have seen over the last week while the prior breakout level is where the share is developing a minor series of higher lows. We also note the trend line support in place since December 2020 while the RSI's bullish divergence supports the idea. It's possible that the share sees a 'flush' toward the 19400c-19700c area at which traders could look to buy on the expectation that the downward trend line (A_B) is breached.
Provisional Trade Levels:
Buy if it trades within the 19300c-19600c range
Stop-loss: 18940c
Target Range: 21000c-21300c
Price At Time of Client Publication: 20087c
For more trade ideas, get in touch today.

Somehow holding onMrP has somehow held on till now, but I'd say if this support breaks it might be in for a move toward

MRP finding support at R204MRP seems to be finding support at R204, although it did break it's previous bull flag and came back its starting to show some signs of strength. A break above R220 will definitely get this share going back to all time highs. For now entries above R204 with a stop loss below that will be decent risk reward trades.

MRP bull flagMRP triggered a bull flag pattern. It showed support at R203 and i will use a close below that level as my stop loss to target R235.
Trade ideas are my own and not financial advice.

MRP - Bull flagA close above R215 triggers the long idea with R235 as full target and stop loss a close below R208.

MRP - Short ideaMRP has run hard after its earnings and has managed to hold R230. A close below that level could see some profit taking and maybe a short term flag in the making. 1st target at R222.50 and full target at R205 should things really get ugly.

Mr. Price- H&S confirmedWeekly close above neckline confirms inverse H&S; which should take us to new ATHs.
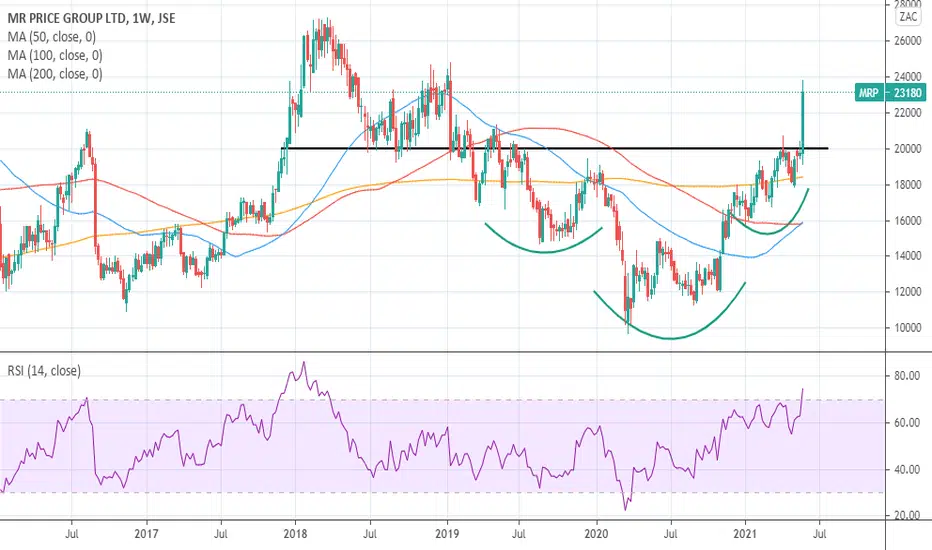

Mr. PriceLooks like we have an inverse head & shoulders technical pattern on the weekly chart, which could take price to new all time highs.
Measured target is above 280.
A convincing break above 200 confirms the pattern.
