Nokia:Inverted Head and Shoulders Structure + Retest of BreakoutOn the weekly chart of Nokia, a classic Inverted Head and Shoulders reversal pattern has formed. The breakout above the neckline occurred with increased volume, confirming the strength of the move. Currently, the price is undergoing a standard technical retest of the neckline from above — a typical
Next report date
—
Report period
—
EPS estimate
—
Revenue estimate
—
0.19 USD
1.29 B USD
19.90 B USD
5.19 B
About Nokia Oyj
Sector
Industry
CEO
Justin Hotard
Website
Headquarters
Espoo
Founded
1865
ISIN
FI0009000681
FIGI
BBG000C02VS4
Nokia Oyj engages in the provision of network infrastructure, technology, and software services. It operates through the following segments: Mobile Networks, Network Infrastructure, Cloud and Network Services, and Nokia Technologies. The Mobile Networks segment offers technologies for Radio Access Networks (RAN) as well as Microwave Radio Links (MWR) for transport networks. The Network Infrastructure serves communication service providers, enterprises, webscales and public sector customers. The Cloud and Network Services segment builds around software and the cloud and is focused on driving leadership in cloud-native software and as-a-service delivery models, as demand for critical networks accelerates; and with strong market positions in communications software, private wireless networks, and cognitive (or intelligent) services. The Nokia Technologies segment, building on decades of innovation and R&D leadership in technologies used in virtually all mobile devices used today, is expanding the Nokia patent licensing business, reintroducing the Nokia brand to smartphones through brand licensing, and establishing a technology licensing business. The company was founded by Fredrik Idestam in 1865 and is headquartered in Espoo, Finland.
Related stocks

NOKIA Nokia and Nvidia have recently announced a strategic partnership centered on pioneering AI-powered telecommunications networks, particularly targeting the transition from 5G to 6G. Key points of the collaboration include:
Nvidia’s $1 billion investment in Nokia, acquiring a 2.9% stake at roughly $6.

NOKIA - Long-Term"Long" Term does not imply "going Long" mind you .. just means .. eh .. like much time ..
Made a nice "Fib", they seem to be important to 'Traders' and 'Anal-ysts®' (not to me, sorry),
I just draw that humbug in here because all my other IDEA's usually have pretty empty charts (see some lines fur

NOK NOK longNokia getting into zone. Selling volume is decreasing.
Technically it's getting closer to 200 MA (4.18) on daily chart.
I expect to bounce upwards.

NOK Nokia Options Ahead of EarningsAnalyzing the options chain and the chart patterns of NOK Nokia prior to the earnings report this week,
I would consider purchasing the 5.50usd strike price Calls with
an expiration date of 2025-11-21,
for a premium of approximately $0.34.
If these options prove to be profitable prior to the earning

Nokia ($NOK): The Most Underestimated Comeback Story in Tech Inf6G Leadership & Strategic Relevance
Nokia is already positioning itself as a major player in 6G development, with research partnerships across the EU, U.S., and Japan.
2 Strong Core Business
Despite macro headwinds, Nokia’s Network Infrastructure and Cloud & Network Services divisions continue to g

Nokia about to pop?Well, i was checking some old charts. Then found this one. Could be a nice trade with a small stoploss

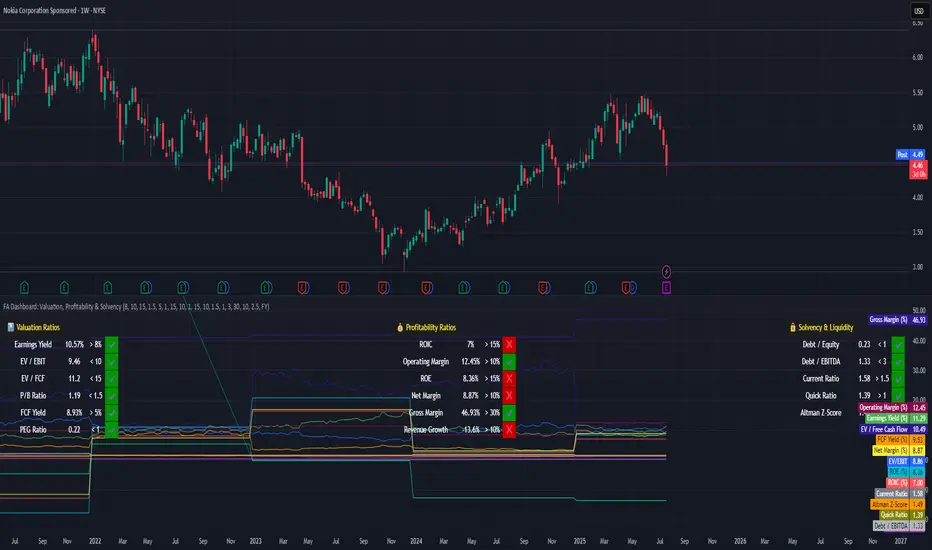
How to Evaluate Companies with a Fundamental Dashboard**Tutorial: How to Evaluate Companies with a Fundamental Dashboard (Example: Nokia)**
This tutorial explains how to use a custom-built dashboard in TradingView to evaluate companies based on key financial dimensions: **Valuation**, **Profitability**, and **Solvency & Liquidity**.
---
🛠 **How to U
NOKIA!!!! Is it Diamond Again? OR? I am in the GAME. I will be waiting 3-10 years. if needed.)))
Jackpot, or I loose my LONG. It's ok. Risk , 3-5% from deposit.

Halftime Update: NOK - Nokia CorporationNokia brought out of it's current channel, tapping $5.14 before pulling back which we expect it to come back to the $4.53 for another potential entry before it's stronger continuation to the upside within this channel, ultimately heading back to the $6.50 Price Levels.
FINANCIAL NEWS:
Nokia Oyj (NY

See all ideas
Summarizing what the indicators are suggesting.
Neutral
SellBuy
Strong sellStrong buy
Strong sellSellNeutralBuyStrong buy
Neutral
SellBuy
Strong sellStrong buy
Strong sellSellNeutralBuyStrong buy
Neutral
SellBuy
Strong sellStrong buy
Strong sellSellNeutralBuyStrong buy
An aggregate view of professional's ratings.
Neutral
SellBuy
Strong sellStrong buy
Strong sellSellNeutralBuyStrong buy
Neutral
SellBuy
Strong sellStrong buy
Strong sellSellNeutralBuyStrong buy
Neutral
SellBuy
Strong sellStrong buy
Strong sellSellNeutralBuyStrong buy
Displays a symbol's price movements over previous years to identify recurring trends.
L
NOK3697111
Lucent Technologies Inc. 6.45% 15-MAR-2029Yield to maturity
5.81%
Maturity date
Mar 15, 2029
See all NOKBF bonds
SLG_OMXH25
Seligson & Co OMX Helsinki 25 Exchange Traded Fund UnitsWeight
9.86%
Market value
68.87 M
USD
ACU7
Amundi MSCI Europe SRI Climate Paris Aligned UCITS ETF DR (D)Weight
2.42%
Market value
57.93 M
USD
Explore more ETFs
Curated watchlists where NOKBF is featured.


Frequently Asked Questions
The current price of NOKBF is 6.06 USD — it has decreased by −1.79% in the past 24 hours. Watch Nokia Corp. stock price performance more closely on the chart.
Depending on the exchange, the stock ticker may vary. For instance, on OTC exchange Nokia Corp. stocks are traded under the ticker NOKBF.
NOKBF stock has fallen by −4.16% compared to the previous week, the month change is a 20.37% rise, over the last year Nokia Corp. has showed a 41.26% increase.
We've gathered analysts' opinions on Nokia Corp. future price: according to them, NOKBF price has a max estimate of 8.49 USD and a min estimate of 3.83 USD. Watch NOKBF chart and read a more detailed Nokia Corp. stock forecast: see what analysts think of Nokia Corp. and suggest that you do with its stocks.
NOKBF reached its all-time high on Nov 6, 2007 with the price of 40.63 USD, and its all-time low was 1.62 USD and was reached on Jul 18, 2012. View more price dynamics on NOKBF chart.
See other stocks reaching their highest and lowest prices.
See other stocks reaching their highest and lowest prices.
NOKBF stock is 8.61% volatile and has beta coefficient of 0.93. Track Nokia Corp. stock price on the chart and check out the list of the most volatile stocks — is Nokia Corp. there?
Today Nokia Corp. has the market capitalization of 37.25 B, it has increased by 2.74% over the last week.
Yes, you can track Nokia Corp. financials in yearly and quarterly reports right on TradingView.
Nokia Corp. is going to release the next earnings report on Jan 29, 2026. Keep track of upcoming events with our Earnings Calendar.
NOKBF earnings for the last quarter are 0.07 USD per share, whereas the estimation was 0.06 USD resulting in a 22.36% surprise. The estimated earnings for the next quarter are 0.17 USD per share. See more details about Nokia Corp. earnings.
Nokia Corp. revenue for the last quarter amounts to 5.67 B USD, despite the estimated figure of 5.45 B USD. In the next quarter, revenue is expected to reach 7.07 B USD.
NOKBF net income for the last quarter is 91.53 M USD, while the quarter before that showed 90.71 M USD of net income which accounts for 0.91% change. Track more Nokia Corp. financial stats to get the full picture.
Yes, NOKBF dividends are paid quarterly. The last dividend per share was 0.03 USD. As of today, Dividend Yield (TTM)% is 2.48%. Tracking Nokia Corp. dividends might help you take more informed decisions.
EBITDA measures a company's operating performance, its growth signifies an improvement in the efficiency of a company. Nokia Corp. EBITDA is 3.19 B USD, and current EBITDA margin is 17.73%. See more stats in Nokia Corp. financial statements.
Like other stocks, NOKBF shares are traded on stock exchanges, e.g. Nasdaq, Nyse, Euronext, and the easiest way to buy them is through an online stock broker. To do this, you need to open an account and follow a broker's procedures, then start trading. You can trade Nokia Corp. stock right from TradingView charts — choose your broker and connect to your account.
Investing in stocks requires a comprehensive research: you should carefully study all the available data, e.g. company's financials, related news, and its technical analysis. So Nokia Corp. technincal analysis shows the sell today, and its 1 week rating is buy. Since market conditions are prone to changes, it's worth looking a bit further into the future — according to the 1 month rating Nokia Corp. stock shows the buy signal. See more of Nokia Corp. technicals for a more comprehensive analysis.
If you're still not sure, try looking for inspiration in our curated watchlists.
If you're still not sure, try looking for inspiration in our curated watchlists.