PEPEUSDT IDEAHello Traders Hope You Are Enjoying Our Analysis. Today We Will Discuss About PEPE
(Update)
On The 1D Timeframe⏳
Moving Exactly As We Expected & Running In +35% Profit So Far☑️
Kill One 0⚡️
PEPEUSDT.PS trade ideas

PEPE Crypto Watch (Bullish Continuation)PEPE is bullish so the continuation is favored; however, there are bearish retracement targets to watch for.

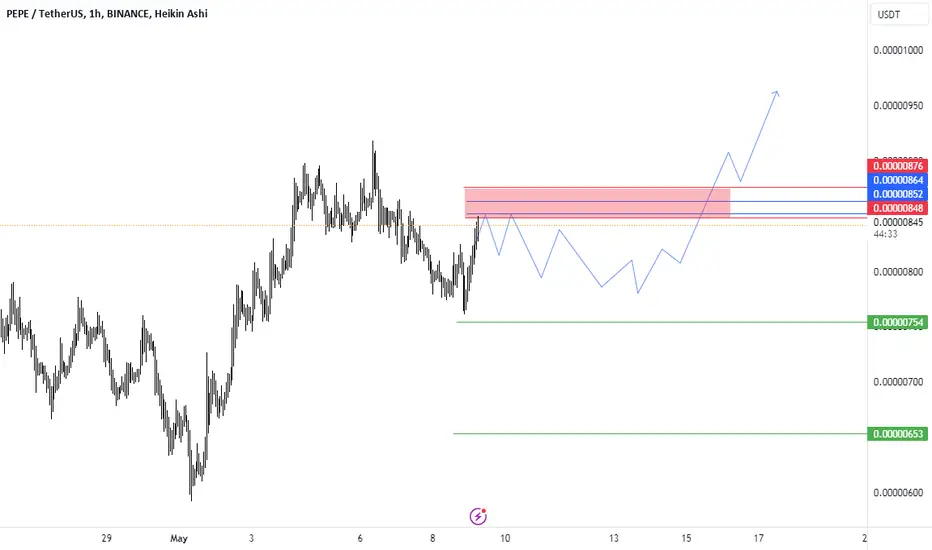
PEPE/USDT: Bull Flag Breakout and Retest, Market Entry NowPEPE/USDT has completed a bullish flag pattern with a breakout and successful retest. The setup suggests strong upward potential, and we're entering the market immediately to capitalize on this momentum. Aiming for a test of the recent high with a risk/reward ratio of 1:2, this trade leverages the current bullish sentiment. With the breakout and retest affirming buyer strength, now is an ideal time to engage for potential gains. Act swiftly to harness the unfolding uptrend.

🔥PEPE IS AT A VERY DELICIOUS POINT AFTER FUDRecent FUD about Pepecoin (PEPE) brought price to the local lows and even below the key level of $0.00..82. A lot of sl were wiped out.
Additionally, huge liquidations give the chance for whales to buy more coins on this BTC dump. Pepe is no exception
The huge support is a low border of the channel. The return inside will be additionall bullish confirmation.
💥Dump ends? Let's see.

🔥Top-3 MEME coins Worth Your Attention❗️Still at the Bottom🚀🔥 Pepe, Floki, Ladys brougt me a lot of profit: from 3x to 13x! What Memecoins that still at the bottom and have a chance to bring you a lot of profit? Watch the video!
🎁 Check my trading ideas for the altcoins that are still at the bottom!
like❤️ and follow

HnS Pattern on $PEPE Coin!!Welcome back guys, sorry i didn't update my analysis lately..
So do you guys see Head and Shoulder Pattern In CRYPTOCAP:PEPE coin tf 4 Hour ?
What should we do ? Buy, Sell or Wait n See ?
Please leave your analysis below

im going to do the impossibleI'm sorry there's just no way this breaks up from here. It looks too easy
I am going to short PEPE
also btc weekly close is looking bearish af unless it pumps from now until tomorrow. 45-50k might be on the table

PEPE Poised for Major Rally as Whales Ignore Friday’s CorrectionThe Pepe price continues to remain resilient in the face of a recent market correction, exhibiting notable strength. market analysts posit that investors can expect CRYPTOCAP:PEPE to climb by 25%.
Despite a significant selling pressure spike observed across the crypto market on May 10, Pepe's ( CRYPTOCAP:PEPE ) price remained unaffected. While Bitcoin ( CRYPTOCAP:BTC ) witnessed a drop of approximately 4%, leading to double-digit declines in many altcoins, the meme coin PEPE remained largely unaffected.
Notably, PEPE's price action appears to be more promising than most altcoins, as it is on track to surpass the local top formed on March 14. Although the price movement has been range-bound, CRYPTOCAP:PEPE has recorded an impressive surge of 134% in under a month, indicating potential for further growth.
Currently trading at $0.00000854 as of the time of writing with a Relative Strength Index (RSI) of 60.36 which is slightly overbought. In conclusion, if the crypto market outlook remains stable, Pepe's price is expected to outperform the market.

pepe → another rising wedge patternhello guys...
as I published before the green area worked great for this coin, you can check it here:
this coin made a rising wedge before and broke it down! now is forming another one if the blue area will break down (I mentioned it on the chart) you can get a long position!
otherwise, you can count on a bullish trend for this coin!
___________________________
✓✓✓ always do your research.
❒❒❒ If you have any questions, you can write them in the comments below, and I will answer them.
❤︎ ❤︎ ❤︎And please don't forget to support this idea with your likes and comment

PEPE TokenThe Pepe token (PEPE) was in a strong upward momentum and is eyeing the All-Time-High (ATH) mark to recapture soon.

KEEP BUYING PEPE TILL 0.00001 IS COMPLETED!!!!!!!!!PEPE have been overall bullish in my previous predictions analysis now price is trying to break out again for another rally from this current point of 0.0000087 to 0.00001
Take a buy entry position now till 0.00001 is completed
JOIN AND ENJOY
Tell us what you think..........

PEPEUSDT UPDATE #PEPEUSDT
UPDATE
Hey all friends and traders. Hope you are enjoying our analysis. we are here to analyze PEPEUSDT today.
Running towards our target .
50% profit done ✅
Expecting more in coming days🚀

pepe trap in a zonepepe trap in zone supply zone is
0.00988 and demand zone is 0.005127 if the price break the uptend the price will fell down to 0.05121
stop loss 0.00098
entry 0.0084
take profit 0.0056

$pepe long pepe ascending triangle , pepe wants new ATH, if we break out of this triangle we go higher .

PEPUSDTWe still expecting more bullish on PEPE, expecting to break the tested resistance with force to the next resistance.

#PEPE/USDT breaks the Diagonal Trednlein and retested in Daily T#PEPE/USDT breaks the Diagonal Trednlein and retested in Daily TF!
CRYPTOCAP:PEPE is looking bullish here. Be ready for a massive pump. The next local resistance level is PWH $0.0000904.

🔥 PEPE Has Room For Massive Growth!PEPE has been performing extremely well over the last few weeks, gaining back almost all losses from March and April.
This made me question where we can see a long-term top? If BTC remains trading neutral/bullish, alts will grow. In which case, I can see PEPE move all the way towards the top of the resistance of the parallel channel.
This could mean an easy 300%-400% growth from this point onwards. A very bullish outlook!


PEPEUSDT.1DEvaluating the daily chart of PEPE/USDT, I can identify several important technical elements and trends that are key to formulating an investment or trading strategy.
Key Resistance and Support Levels:
Resistance 1 (R1): $0.0000946 - This is a significant level where the price recently peaked, indicating potential selling pressure at this price point.
Support 1 (S1): $0.0000580 - This level is acting as the immediate support where the price could potentially find a floor if it retraces.
Support 2 (S2): $0.0000387 - A lower support level that could come into play if there is a substantial breakdown below S1.
Support 3 (S3): Lower still, it acts as a further fallback should a significant selloff occur.
Technical Indicators:
Relative Strength Index (RSI): Currently at 56.99, the RSI suggests a slightly bullish momentum but still under the overbought threshold of 70, providing room for potential upward movement without immediate risk of reversal due to overbuying.
Moving Average Convergence Divergence (MACD): The MACD line is above the signal line but very close to it, indicating mild bullish momentum. However, the proximity to the signal line suggests that this could easily swing if market sentiments change.
Trend Analysis:
The chart shows a rising trend line, indicating an ascending support level that the price has been following. This pattern suggests that as long as the price remains above this trend line, the bullish outlook remains valid. However, the proximity of the price to this trend line also means that any break below could signal a change to a bearish trend.
Conclusion:
Based on the analysis of the PEPE/USDT chart, the market is currently showing signs of consolidation within a bullish trend, as indicated by the rising trend line and the RSI's position. A prudent strategy would involve monitoring the price action around the immediate support level at $0.0000850. If the price holds above this level, it could be an opportunity to buy with a target of R1 at $0.0000946, setting a stop loss slightly below the trend line to mitigate risk.
Should the price break below the trend line, it would be wise to reassess the bullish stance, as it could indicate a shift to a bearish trend, potentially targeting lower supports at S2 and S3. As always, monitoring volume and market news will be crucial in confirming these signals and adjusting strategy accordingly.

PEPE/USDT BUY CONTINUES!!!!!!!!!!!PEPE completed my last analysis predictions now price is heading towards my prediction at 0.00001 am still taking more buying entries from this zone till we completed targets
JOIN AND ENJOY
Tell us what you think..........?

PEPE going to 0.0000075934I think a crash for the pepe cryptocurrency is underway, with the first TP (Take Profit) being 0.0000075934. The method of calculation is based on Gap, which is very accurate. The ascending gap must occur, followed by a descending gap, indicating that the ascending gap has occurred and the price drop is ready to happen.

🐸📈 PEPE Trading Analysis 🚀💡Market Observation:
Amidst the ongoing meme coin frenzy, PEPE appears to be consolidating for a potential upward movement. With a recent higher high and temporary shift in structure away from the downside, there's anticipation for a higher low formation.
Trade Setup:
Entry: Consider entering the trade between $0.00000650 - $0.00000725, aiming for a favorable risk-reward ratio.
Take Profit: Set profit targets at $0.000011 and $0.000013 to capture potential upside movement.
Stop Loss: Place the stop loss at $0.000006 to manage risk effectively.
📊🚀 Monitor PEPE's price action closely for trade execution! #PEPETrading #CryptoAnalysis 🌐💰
