PERPUSDT UPDATE #PERPUSDT
UPDATE
Hey dear traders hope you are enjoying trading and analysis with our team. we are here to discuss about PERPUSDT
Falling wedge Breakout done in 1D time frame ✅
Expecting 60% + profit 📈
PERPUSDT trade ideas

PERPUSDT Potential W Formation and Ascending AccumulationPERPUSDT demonstrates the formation of a potential W setup, marked by price accumulation within an ascending structure. Presently, the price is confined within a range that encompasses crucial Points of Interest (POI) and a Key Neckline Zone.
The POI serves as a strategic area for buy accumulation, while the Key Neckline Zone holds significance as a pivotal point for potential breakout. An upward breach of this zone might trigger a robust rally, signifying a strong bullish momentum.
The target for this potential formation is outlined on the chart, offering insights into potential price movement.
This analysis warrants close observation. Your support matters! Boost this post for wider reach and ensure to follow us for continuous updates.

PERPUSDT IDEAHey traders hope you are enjoying our analysis. Now we are here again with a new trading opportunity. We will discuss today about PERP
PERP The bullish pennant Breakout has Already Confirmed in Daily Time frame✍️
Expecting 50-60% Bullish wave 🚀

PERPUSDT UPDATE #PERPUSDT (Update)
Hey all friends and traders. Hope you are enjoying our analysis. we are here to analyze PERP today.
PERP has Successfull Breakout done in 1D time frame.
Expecting Massive Bullish wave

PERPUSDT impulse or triangle into 400%On the higher time frame, we have failed to go back into the range value from May 2022 to Jan 2024
On the medium time frame, we have entered into the range value of from Jan 2024 to April 2024. This attracts a rotation to its value POC or VAH. The said range can also be said as an ABC correction and we are ready for a wave 3 impulse.
Currently we have the range's VAL as a support which currently, a wave 3 impulse is more probable. If we lose the VAL as a support we will be looking forward to see the 5 wave triangle.
However, I am looking forward to the higher time frame trade.
On the PERPBTC chart we have made an actual spring, confirming we are ready to rotate from the range value
This is a long opportunity for both short and long term trade.
One and only invalidation is having 0.98 back as a resistance
Bullish triangle must have its subwave 4 on 0.98 as a support

$$$PERPUSDT IDEA UPDATE$$$Dear Respected Traders, we hope this communication finds you well.
we are convening a discussion focused on #PERPUSDT
The Bullish Pennant Pattern is Formed ✅
Now it's Ready to Break the Pattern ✅
In Case of Successful Breakout ✅
Expecting a Bullish Move of 50% in Coming Days 🚀
#Bitcoin #Crypto #Ethereum #Cryptocurrency #CryptoTrading #BTCUSDT #ETHUSDT #ALTCONS #USDT CRYPTOCAP:BTC CRYPTOCAP:ETH CRYPTOCAP:USDT

PERPUSDT IDEAHey traders hope you are enjoying our analysis. Now we are here again with a new trading opportunity. We will discuss today about PERP
ON The 12H Time Frame ✍️
THE Falling wedge Breakout Has Already Done ✅
Expecting 30% Bullish wave 🚀📈

PERPUSDT: Bullish Engulfing at 200 Moving Average and SupportPERP has Bullishly Engulfed above a major Support/Resistance Level and looks to be forming a Double Bottom of sorts with Bullish Divergence on the MACD. If it plays out we could very well see higher highs and may actually see a macro Bullish Breakout of an even bigger pattern of higher lows and higher highs on the Weekly, but for the time being I'd just want it to try to recover the range highs of the daily Double Bottom.

Trading Signal For PERPUSDT PERP Trading Setup:
There is a Trading Signal to Buy in EURUSD Currency Pair.
Traders can open their Buy Trades NOW
⬆️Buy now or Buy on 0.836
⭕️SL @ 0.560 (-48%)
🔵TP1 @ 1.799 (+62%)
🔵TP2 @ 2.818 (+158%)
🔵TP3 @ 3.757 (+245%)
What are these signals based on?
Classical Technical Analysis
Price Action Candlesticks Fibonacci
RSI, Moving Average , Ichimoku , Bollinger Bands
Risk Warning
Trading Forex, CFDs, Crypto, Futures, and Stocks involve a risk of loss. Please consider carefully if such trading is appropriate for you. Past performance is not indicative of future results.
If you liked our ideas, please support us with your likes 👍 and comments .

Trading Signal For PERPUSDT PERPTrading Setup:
There is a Trading Signal to Buy in EURUSD Currency Pair.
Traders can open their Buy Trades NOW
⬆️Buy now or Buy on 0.836
⭕️SL @ 0.560 (-48%)
🔵TP1 @ 1.799 (+62%)
🔵TP2 @ 2.818 (+158%)
🔵TP3 @ 3.757 (+245%)
What are these signals based on?
Classical Technical Analysis
Price Action Candlesticks Fibonacci
RSI, Moving Average , Ichimoku , Bollinger Bands
Risk Warning
Trading Forex, CFDs, Crypto, Futures, and Stocks involve a risk of loss. Please consider carefully if such trading is appropriate for you. Past performance is not indicative of future results.
If you liked our ideas, please support us with your likes 👍 and comments.

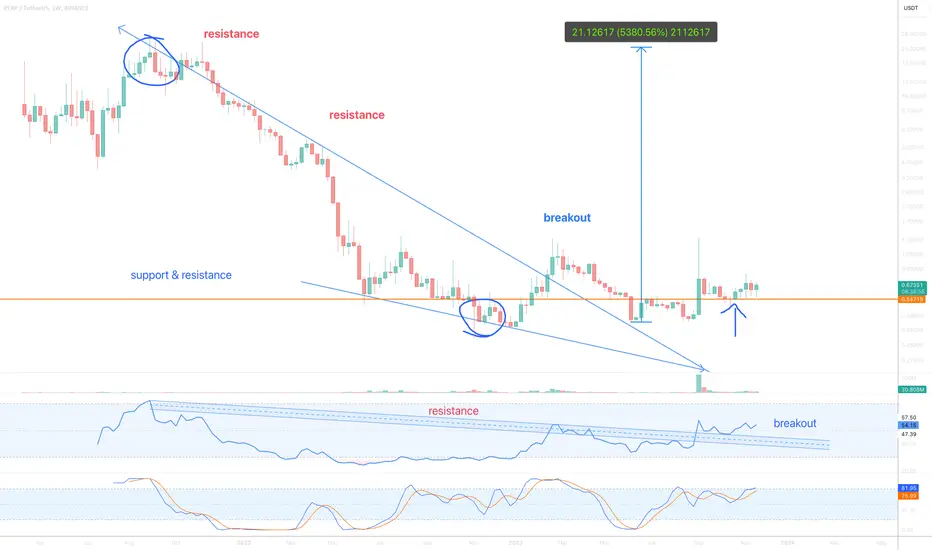
Perpetual Protocol (PERP) to $20On the above weekly chart price action has corrected 97% since September 2021. A number of reasons now exist to consider a long position. They include:
1) Price action and RSI resistance breakouts.
2) Support and resistance. Price action confirms support on past resistance (see arrow). Look left.
3) GRM support has already confirmed.
4) The falling wedge breakout and confirmation forecast a 5000% move from the breakout point. Forecast is measured from low to highest touchpoints within the wedge (blue circles).
Is it possible price action corrects further? Sure.
Is it probable? no.
Ww
Type: trade
Risk: <= 6%
Timeframe for long: Yesterday
Return: 50x
$PERP Double Bottom formation + bullish pennant along the neck$PERP
Double Bottom formation + bullish pennant along the neckline of the one (sign of incoming breakout)👀
Looking bullish📈
🎯 Target for the setup - 4$

PERPUSDT.4HThe PERP/USDT 4-hour chart indicates a range-bound market, where the price is oscillating between the support at S2 and resistance at R1. The price recently rebounded from S2, suggesting that this level is acting as a strong support zone.
The RSI is quite elevated, nearing the overbought territory at around 73. This could signal that the price might be reaching a point of temporary exhaustion, and a pullback or consolidation might be due shortly.
The MACD is above the signal line and above zero, which is a bullish signal. However, the proximity to the signal line suggests that the bullish momentum could be losing strength.
The current price is approaching resistance level R1. If the price breaks above R1, it could signal a continuation of the uptrend with the next target being R2. Conversely, if the price fails to break R1 and reverses, the support level S2 may again be tested. A break below S2 could indicate a shift to a bearish trend.
In summary, as a trader, I would watch how the price reacts at R1. Given the RSI’s high level, I would be cautious of a potential pullback. A confirmed breakout above R1 could be a possible entry point, while a rejection at R1 could be a signal to anticipate a retracement.

✴️ Perpetual Protocol Big Ascending Triangle (590% Potential)For Perpetual Protocol, PERPUSDT, we have a huge ascending triangle with action happening above MA200.
A nice signal here comes after the early September peak. Bearish volume was really high, ultra-strong yet PERPUSDT continued to move within a higher low compared to mid-August. This is a signal of strength (bear pressure neutralized).
Since October we have slow and steady growth, a kind of bullish consolidation which tends to lead to a sudden jump.
This is all great but remember, the chart is always changing so this pairs potential can also change. It is wise to prepare before taking action... Study, practice, build a plan/strategy, write it down and follow it until the end.
I am wishing you tons of profits, good luck, wealth, health and success. Now and forever more.
You deserve the best.
Namaste.

✴️ Same Pattern, Same Potential | Perpetual Protocol vs Tether We've been seeing this pattern: PERPUSDT tends to breakout when Bitcoin moves. It tends to break the opposite way.
➖ Here we can see PERPUSDT moving up, breaking bullish and so this might mean that Bitcoin is ready to produce its retrace.
Notice the same pattern on the left and right side.
👉 This pattern can be defined as an ascending triangle, a continuation pattern and thus higher prices expected.
Perpetual Protocol has been growing since November 2022.
Namaste.

PERPUSDT IDEAHello Traders Hope You Are Enjoying Our Analysis. Today We Will Discuss About PERP
(Update)
The Symmetrical Triangle Breakout Has Done In Weekly Timeframe⚡️
Expecting Massive Bullish Wave Towards 600% In Coming Weeks✍️

PERPUSDT IDEAHey traders hope you are enjoying our analysis. Now we are here again with a new trading opportunity. We will discuss today about PERP
PERP Formed Rising Wedge In Weekly Timeframe Incase Of Breakout Expecting Move Towards 3.37$

PERP to $5SL: $ 0.70
If you want to play this in the short term first exit @
TP1: $ 3.6
TP2: $ 5.9
Longer-term spot exit
TP3 : $ 18


PERP/USDT I BUY SETUP✔︎📈 BINANCE:PERPUSDT SIGNAL
✔︎ENTRY : 1.51645
🏓TARGETS :
✔︎ T1 : 1.65167
✔︎ T2 : 1.78688
✔︎ T3 : 1.95404
✘ STOP : 1.43550
🚦Stop Trigger:
• If you make capital management: Stop is activated when one candle opening and closing
below the stop level of the same time frame of the signal.
• If you don't make capital management: Stop is direct without waiting for the candle to close.
💡Risk management :
• Enter the trade with 10% to 20% of your capital to reduce risk and save cash to enter other opportunities.
• Sell (25% to 50%) on (T1) and don't move your stop-loss.
• Sell 50% on (T2) and move your stop loss to the entry point.
• You are safe now, and the next 25% is up to you.
💡Reason for this trade:
This trade gives my trading system a sign of strength:
• My trading system is based on liquidity and reversal zones.
• When the liquidity is swept from one side under certain conditions, we will wait for the price on the other side.
The liquidity will attract the price like a magnet.
• the first side that has been swept:
1- range low
2- failure swing point
• Opposite side targets:
1- range high
2- qual liquifty
💡Entry setup
1- reclaim Volume profile POC
⚠️WARNING:
• I'm not a financial advisor.
• Do your own research (DYOR).

Perp/Usdt Looks Promising For Next Leg Up The Perp/USDT pair is currently displaying a triangle pattern in its price movement. In my analysis, I believe that the price is likely to break out of this triangle pattern soon. If this breakout is successful, we could see a bullish move of 50-100%.
Please note that this analysis is based on my personal opinion and is not financial advice. DYOR (Do Your Own Research) before making any trading decisions.

PERP has formed a Bullish pattern after the breakoutPERP has formed a Bullish pattern after the breakout
🔵Entry Zone 1.54056 - 1.58932
🔴SL 1.4136
🟢TP1 1.7128
🟢TP2 1.9900
🟢TP3 2.4700
Risk Warning
Trading Forex, CFDs, Crypto, Futures, and Stocks involve a risk of loss. Please consider carefully if such trading is appropriate for you. Past performance is not indicative of future results.
If you liked our ideas, please support us with your likes 👍 and comments.

Perp/Usdt Idea The Perp/USDT pair is currently displaying a bullish trend. On the daily time-frame, a Triangle Pattern has been formed. I anticipate that the price will soon break out of this pattern. A bullish move of approximately 40-80% is expected in the short term.
Please note that this information is not intended as financial advice.
