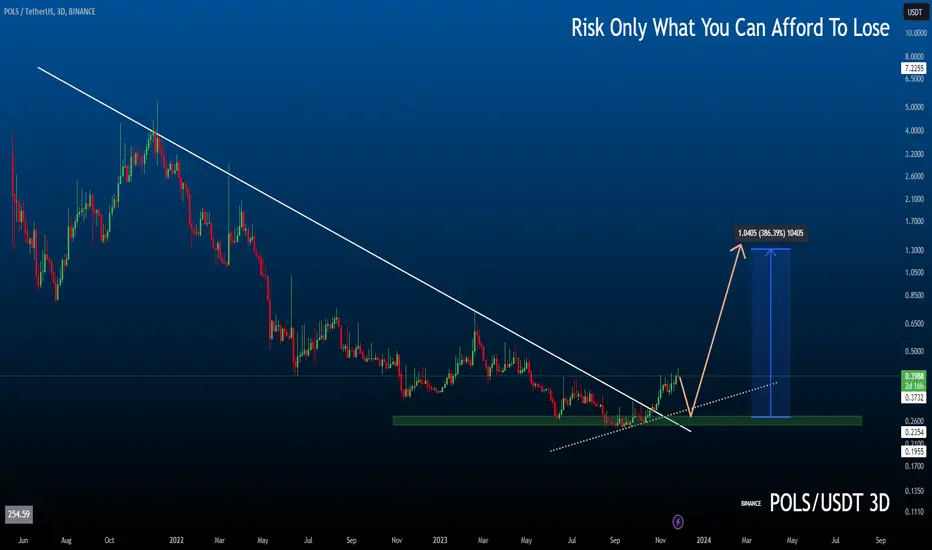
Polkastarter (POLS)On the above 3-day chart price action has corrected over 90% since the sell signal in October 2021 (not shown). Now is a good opportunity to go long. Why?
1) A strong buy signal prints. (not shown).
2) Price action resistance breakout.
3) Strong positive divergence between price action and multiple oscillators. This divergence occurs over a 90 day period. The idea is a mirror copy of the LCX idea 48hrs ago.
Is it possible price action could fall further? Sure.
Is it probable? No.
Ww
Type: trade
Risk: <=6% of portfolio
Timeframe: Don’t know.
Return: Don’t know.
POLSUSDT trade ideas

POLS/USDT Poised for a Bullish Break from the Demand Zone?🚀POLS💎Paradisers, attention is due as #POLSUSDT showcases a compelling maneuver, nestled within a demand zone and on the verge of a potential bullish breakout.
💎 Observing #POLS, we've identified a descending channel pattern, with current price action flirting with the horizontal supply zone between $0.8699 and $0.9702. Now, as the price pivots back towards this range, there's a burgeoning chance for it to sustain its upward trajectory and launch into a significant bullish journey once more.
💎 As astute traders, we're always contemplating alternate outcomes. Should the initial bullish anticipation not materialize, we're eyeing a bullish recovery from a secondary point of interest at the lower demand level of $0.7681. A descent below this marker could spell a considerable retreat.

POLSUSDT IDEAUPDATE
Formation of Bullish Pennant in 12H TF.
Breakout can take it towards 1.40💲 and above !!!
COIN DETAILS
The live price of Polkastarter is $ 0.730595 per (POLS / USD) with a current market cap of $ 72.49M USD. 24-hour trading volume is $ 2.47M USD. POLS to USD price is updated in real-time. Polkastarter is -4.87% in the last 24 hours with a circulating supply of 99.22M.

POLSUSDT(Polkastarter) Daily tf Range Updated till 31-01-24POLSUSDT(Polkastarter) Daily timeframe range. volume is draining from here. but it needs to stay above 0.7086 to sustain. if not than will visit 0.5134 or lower.

Polsusdt trading opportunityThe POLSUSDT pair has completed a 5-wave decline and is now showing signs of bullish recovery. We anticipate an impulsive move to test the extreme supply area, as indicated on the chart.
The provided buy-back zone is ideal for long accumulation. It is recommended to use an appropriate stop-loss and your engagement with likes and comments will be appreciated.
Thank you.

POLSUSDT Skyrockets by 249%, Reaching $1.3976! 🚀All Targets: done✅
Entry price: 0.400$✅
Price reached :1.3976$ ✅
Profit: 249% ✅🚀🚀🤑
In a remarkable surge, the cryptocurrency POLSUSDT has experienced an impressive gain of 249%, achieving a notable price of $1.3976. This substantial ascent underscores the coin's strong bullish momentum, capturing the attention of traders and investors alike. Stay tuned for further insights as POLSUSDT continues its upward trajectory in the dynamic world of cryptocurrency.

#POLS/USDT#POLS
The price has been moving in a bear flag since July 2022
We are about to break that pattern by breaking the downtrend
Supported by oversold on MACD
Current price 0.4050
First target 0.6745
Second goal 0.9448
Which represents 200% of the current price
This rise is supported by the breakout of the Moving Average 100
You must pay attention to the correction points on the chart

POLSUSDT(Polkastarter) Daily tf Range Updated till 16-12-23POLSUSDT(Polkastarter) Daily timeframe range. some insane pumps from alts. whoever got into consolidation period made serious amount of money. 1.1432 is a hold up for now it already tried. getting past it clean will open up space till 1.6504.

Quick 10% tradePols trade is at support level and ready to bounce up at least 10% from this support.

Pols 1d worth the risk but... It is to maintain this level even for a whole before the breakout!
But if it doesn't hold this level and closes 1d below the light blue line, then wait for it at the blue area
All the best insha Allah!

POLSUSDT IDEAFalling wadge up side breakout is already done in 1D time frame
Expecting massive bullish wave moving as expected running in 70% profit so far

$POLS #POLS The trend line has been breached, and it appears that a minor uptrend is commencing. We are awaiting a retest, after which we can anticipate a potential gain of +350%.
POLSUSDT IDEAHello Trading view Family / Fellow Traders.
I hope you have used and benifited from the previous analysis .
In today trading session we are monitoring POLSUSDT for a buying opportunity...
POLSUSDT UPDATE
Pols has breaked the main Falling Wedge in 1D timeframe . Here it has Maximum chance we can see gain up to 70% in next few days.

POLS Buy SignalPOLS may recover like UMA .. in the next 24 hours. However.. is may also pullback.
This is just a random buy signal
Some targets on chart.

POLSUSDT IDEAHello Trading view Family / Fellow Traders.
I hope you have used and benifited from the previous analysis .
In today trading session we are monitoring POLUSDT for a buying opportunity..
POLUSDT UPDATE
Falling Wedge Formation in 1D Timeframe...
Upside Breakout is already done , Expecting Massive Bullish Wave📈
Moving As Expected Running In 60% Profit ✍️

POLSUDT - In Bearish TrendThis pair has formed a bearish divergence along with a descending triangle pattern which seems to suggest it will continue the downward movement. We will place a sell stop below the LL with a stop loss on the last HL.

Keep an eye #POLS/USDT in Daily TF!Keep an eye #POLS/USDT in Daily TF!
$POLS is trying to break the Diagonal Trendline. If it breaks the TL, It will pump hard towards PMH $0.339.
Looking good for Spot.

$Pols ready for go..There may be a nice price increase with the falling wedge breakout. Worth to try..

POLS long to .39-.41c then Short to .21c Not financial advice
Like and follow
Almost all altcoins except a few are displaying same pattern over and over.
Clear resistance at .39c but have room to move here up another 15-20% before final drawdown.
Overall I like this project and always been a fan of it
Always DYOR and practice patience
#PIK
Patience is Key
And #TLAW
Think Like a Whale


Polkastarter Must be taken Seriously and Invested Now 22/02/2021polkastarter as the next step for truly interoperable DeFi. A Protocol built for cross-chain token pools and auctions, enabling projects to raise capital on a decentralized and interoperable environment based on Polkadot.
With Polkastarter, decentralized projects will be able to raise and exchange capital cheap and fast. Users will be able to participate in a secure and compliant environment and to use assets that go way beyond the current ERC20 standard.
In order to leverage advantages, smooth interoperability between various networks is a key to success. The killer feature of Polkastarter is the possibility of making cross-chain swaps, powered by the Polkadot ecosystem, which can provide higher throughput for faster and cheaper transactions while staying connected to the Ethereum Network and other blockchains for liquidity.
Other features include permission less listings, token swaps by smart contract, private pools with password, whitelisting and high slippage price alerts.
Pools will have several types of swaps, including fixed ratio swaps, dynamic ratio swaps, dutch auctions and even sealed-bid auctions.
Technical:
we may see some retracing and bearish move down but it is ultimately will raise and rally as this protocol is very essential and we can target the Fibonacci expansions as our coming targets
there are total of 2 TPs which one is blow the ATH and the other is above it and can be counted as a starting place

🔥📉 Falling Wedge Alert on $POLS! Bullish Reversal Brewing?Hey traders! Today, I want to bring your attention to an intriguing chart pattern on $POLS (Polkastarter). Let's dive into the falling wedge pattern and explore the potential for a bullish reversal. 📊💡
Pattern: Falling Wedge 📉🔽
Symbol: $POLS 💰
Overview:
A falling wedge is a bullish chart pattern characterized by converging trendlines, with the upper trendline sloping downward and the lower trendline sloping upward. It often signals a potential trend reversal from bearish to bullish. Now, let's analyze the falling wedge pattern on $POLS in more detail. ⚡💹
Key Features of the Falling Wedge on $POLS:
Converging Trendlines: Notice how the upper trendline connects lower highs, while the lower trendline connects higher lows. This pattern suggests a potential shift in market sentiment. 📈📉
Decreasing Volatility: Observe the gradual contraction of price range and declining trading volume as the pattern develops. These characteristics may indicate diminishing selling pressure. 📉🔻📈
Breakout Expectations:
A falling wedge pattern often precedes a bullish breakout. Traders typically await a decisive move above the upper trendline for confirmation. However, exercise caution and wait for a clear breakout before initiating trades. 🚀📈
Trading Strategy:
Entry Point: Consider entering a long position once $POLS breaks above the upper trendline of the falling wedge pattern. This breakout could signal a potential trend reversal and the start of a bullish move. ⬆️💰
Stop-Loss: Place a stop-loss order below the lower trendline to manage risk and protect against potential downside. ⛔️📉
Target Levels: Identify key resistance levels or previous swing highs as profit targets. Adjust your position size and take profits accordingly. 🎯📈
Risk Management:
Implement proper risk management techniques, including position sizing, stop-loss orders, and adherence to your trading plan. Always be mindful of the inherent risks involved in trading cryptocurrencies like $POLS. ⚠️💼💡
Disclaimer: Trading cryptocurrencies carries risks, and it is essential to conduct thorough analysis and seek professional advice before making any investment decisions.
#FallingWedge #POLS #Cryptocurrency #BullishReversal #TradingStrategy #TechnicalAnalysis #ProfitTargets #RiskManagement
In conclusion, the falling wedge pattern identified on $POLS indicates the potential for a bullish reversal. However, exercise patience and wait for a confirmed breakout before making any trading decisions. Stay tuned for further updates on $POLS! 🚀📊
(Note: This post is for informational purposes only and should not be considered as financial advice.) 💡💼📚

#POLS/USDT - Long - Potential 7.28%Direction: Long
Market: Spot
Risk: 0.25% - 1%
#USDT_POLS
Exchange: BINANCE
Timeframe: 360
TP1: 0.486
Entry: 0.453
STOP: 0.42
Entry Conditions:
| Trendbreak
| CDV resistance break
| Volume confirmed
