POLYUSD trade ideas

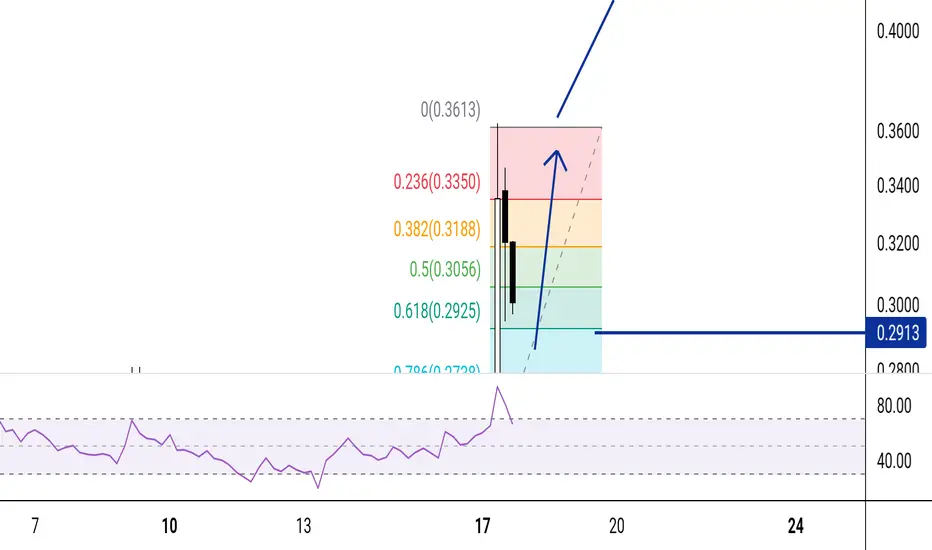
POLYUSD Crucial bullish break out. Just 1week MA100 left now.Polymath / POLYUSD crossed over the Falling Resistance, which has been supressing the price during the Bear Cycle since the August 2021 High.
In the meantime, the price succesfully crossed also over the 0.236 Fibonacci level.
The last Resistance standing is the 1week MA100 (sitting on the 0.382 Fib).
If broken, take a buy position and target 0.4775 (Fibonacci 0.618 and September 5th 2022 High).
Notice that the 1week MACD is very undervalued, on a Bullish Cross under the 0 mark.
Follow us, like the idea and leave a comment below!!

POLYUSD Wait for a clear break out.POLYMATH is having a strong (1d) candle, crossing over both the MA50 and MA200 (1d).
This is not a bullish signal yet as the long term pattern remains a Channel Down, particularly bearish under the Falling Resistance.
Trading Plan:
1. Sell as long as the (1d) candles close under the Falling Resistance.
2. Buy if it closes over it.
Targets:
1. 0.1150 (Support 1).
2. 0.2100 (Fibonacci 0.5).
Tips:
1. The RSI (1d) is overbought. It favors short term selling.
Please like, follow and comment!!

POLYUSD Crossed over the Bear Cycle's Resistance! Major move!Polymath / POLYUSD crossed today above the Falling Resistance that dated back to September 4th 2021, the start of the Bear Cycle.
This is the first major bullish breakout signal, with the second and more decisive being when it will cross above the 0.382 Fibonacci level.
Be ready to buy that breakout and target the 0.618 Fibonacci at 0.4800, which was the September 8th 2022 (Lower) High.
Previous chart:
Follow us, like the idea and leave a comment below!!

POLYUSD testing the 2021 Resistance!Polymath (POLYUSD) is having an incredible 2-day stretch and is testing the Lower Highs trend-line (from October 06 2021) for the first time September 08 2022. A 1D candle closing above it will be a buy signal for us, targeting 0.3250 (the 0.382 Fibonacci) on the short-term and if another candle closes above it, then Resistance 1 (0.4750).
On the contrary, as long as we close below the Lower Highs trend-line, we will sell and target the 1D MA50 (projected target at 0.1850). With the 1D RSI testing the overbought Resistance, there are high probabilities for a rejection.
-------------------------------------------------------------------------------
** Please LIKE 👍, FOLLOW ✅, SHARE 🙌 and COMMENT ✍ if you enjoy this idea! Also share your ideas and charts in the comments section below! **
-------------------------------------------------------------------------------
💸💸💸💸💸💸
👇 👇 👇 👇 👇 👇

POLYUSD - 4HIn the four-hour time frame, we saw a 40% growth of this currency and it is correcting in the 0.618 Fibonacci area, this currency can grow up to 0.47 in the medium term.
POLYUSD - Further Upsides? Horizontal lines can be drawn and used as points of resistance
The recent bull move kicked price up to the middle line
Now the move we are seeing may extend to the upper line, breaking past the horizontal resistance in red
1.618 of this fib circle seems to be acting very bullishly for POLY
I would like to see 0.5c

Polymath weekly outlook. What a amazing pump!
It’s nice to see such a big pump during these market conditions.
All eyes on the weekly close this Sunday. We want the weekly candle to close above the current trend line we are just under.
What’s everyone think?

Polymath (POLY) formed big bullish Gartley for upto 966% rallyHi dear friends, hope you are well and welcome to the new trade setup of Polymath (POLY).
After the previous major drop of 2020, I shared the below harmonic move with you and Poly surged more than 750%
Now after the current major drop, on a weekly time frame, Poly has formed a bullish Gartley pattern:
Note: Above idea is for educational purpose only. It is advised to diversify and strictly follow the stop loss, and don't get stuck with trade

POLYUSD falling wedge bullish breakout on DailyPOLYUSD breakout to upside. bouncing off .886 fib reset since selling off from recent swing high.

Crypto currency technical strategyIT is a small trend of the technical aspects of the crypto currency

INVERSE H&S SET UPThis could dip slightly more but I expect a big move up past 0.70 by next week or so.

Is nobody else seeing this?!Look at that double tap sweeetness! Lions are fearless, so let them be hungry while we feast! DCA is responsible


Falling Wedges Break to the UpsideTake a look at this wedge forming, with BTC just warming up this coil is ready to spring out quick IMO!

POLY POLY has been in a long period of consolidation and is currently at a major resistance level. Watch for breakout.

POLYUSD Bull AnalysisPOLYUSD is in favour of the bulls at this point
After a period of consolidation and a minor downtrend, price has reached a point where it is time to move up again
This downtrend period can be displayed as a triangle pattern
Three lines can be drawn along trends in the downtrend, the third showing where price has placed itself right above
It is also sitting right on the 50MA which in past has been a point of support for price

POLYUSD - BullishBullish.
triangle pattern evident. Good demand zone of accumulation. Holding key supports and poking and persisting resistance levels,
Probability is a breakout from this triangle. within 6 weeks is probable and plausible may retest lower supports before blast off.

PolyusdNot financial advice.
I see PolyUSD to cross 1$ on way to 1.60$ If we crossed 0.94c and 0.97c$ based on my experience.


PolyUSDi see
ployusd moving first target is 1.07$ second target 1.122$ or more.
not financial advice do your own research its just my idea based on the TA.

PolyUSDBased on my TA i see polyusd first target at 1.09$ Or 1.22$ USD in next 2/3 days again do your own research and its not financial advice. Its just my idea 57% gain coming.

Poly Buy
Top in the .80 area.
Possibly breakthrough to continue threw the upward channel or else it would continue to fill the wedge.
