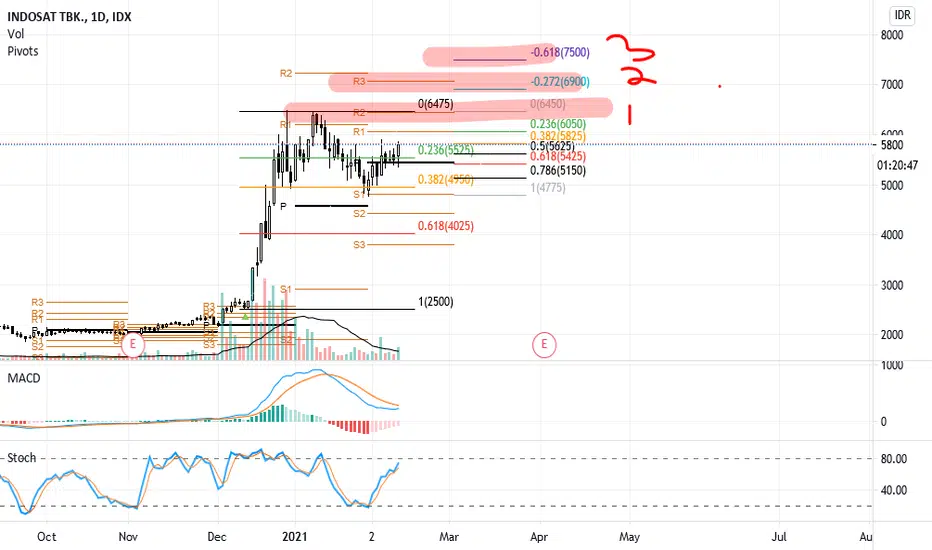
ISAT long termHot news NVIDIA is so hot
Target buy price: for avg cap price below 10000
Long term TP target: 15000~16000
or hold wait and see
Escape plan: bellow 8000 can be used for CL at 9000
lets see if fundamental & technical will be synchronized
mean time the news usually be up and down.
Enjoy the roller
PT Indosat Tbk
No trades
Next report date
—
Report period
—
EPS estimate
—
Revenue estimate
—
0.0103 USD
330.58 M USD
3.39 B USD
5.28 B
About PT Indosat Tbk Class B
Sector
Industry
CEO
Vikram Sinha
Website
Headquarters
Jakarta
Founded
1967
IPO date
Oct 19, 1994
Identifiers
2
ISIN ID1000097405
PT Indosat Tbk engages in the provision of telecommunications, information technology, and mobile communications services. It operates through the following segments: Cellular, Fixed, and MIDI. The Cellular segment provides the network coverage in all major cities and population centers across Indonesia by using vast range of technologies from 2G, 3G, and the latest 4G. The Fixed segment offers products and services such as international calls, fixed line, and network interconnection. The MIDI segment covers products and services which include fixed connectivity, IT service, and fixed internet. The company was founded on November 10, 1967 and is headquartered in Jakarta, Indonesia.
Related stocks

ISAT: Buy on BreakoutISAT just broke out its downtrend channel, and now pulled back to its minor support. If it can exceed 5850 will be potential area to buy with 6400 as the target.

IDX: ISAT FOR NEXT WEEK 8-12 NOV 2021MEDIUM SUPPORT AT 6925
WEAK RESISTANCE AT 7100
I PREFER YELLOW TRADING PLAN
Disclaimer:
This information is for educational purposes and is not an investment recommendation or representative of professional expertise. This analysis used herein is for illustration purposes only. This personal opini

ISATISATtest Analysis for trial new player
=========================================
=========================================

IDX: ISAT FOR NEXT WEEKMEDIUM RESISTANCE AT 6350
MEDIUM SUPPORT AT 6175
I PREFER YELLOW TRADING PLAN
Disclaimer:
This information is for educational purposes and is not an investment recommendation or representative of professional expertise. This analysis used herein is for illustration purposes only. This personal op

ISAT area of interesting to buyAfter such strong move, Isat start to pullback. Traders need to wait until golden fib area for buy and hold long term.


VCP- ISAT - Swing TradeVCP pattern is detected on ISAT, showing accumulation as the volume is decreasing from the start of VCP 1 to the end of VCP 3, with pivot is confirmed on 16/03. The ideal buy point 5950-6000, with first TP at 6525 then 6900. Cut loss if price break 5800. To add, golden cross also detected in stochas

ISATNB: DO MIND that These analyses I posted here are intended as my notes and not as investment recommendations or as financial advice!NB: DO MIND that These analyses I posted here are intended as my notes and not as investment recommendations or as financial advice! Please also note that you are alway

See all ideas
Summarizing what the indicators are suggesting.
Neutral
SellBuy
Strong sellStrong buy
Strong sellSellNeutralBuyStrong buy
Neutral
SellBuy
Strong sellStrong buy
Strong sellSellNeutralBuyStrong buy
Neutral
SellBuy
Strong sellStrong buy
Strong sellSellNeutralBuyStrong buy
An aggregate view of professional's ratings.
Neutral
SellBuy
Strong sellStrong buy
Strong sellSellNeutralBuyStrong buy
Neutral
SellBuy
Strong sellStrong buy
Strong sellSellNeutralBuyStrong buy
Neutral
SellBuy
Strong sellStrong buy
Strong sellSellNeutralBuyStrong buy
Displays a symbol's price movements over previous years to identify recurring trends.
Frequently Asked Questions
The current price of PTITF is 0.1317 USD — it has increased by 14.72% in the past 24 hours. Watch PT Indosat Tbk stock price performance more closely on the chart.
Depending on the exchange, the stock ticker may vary. For instance, on OTC exchange PT Indosat Tbk stocks are traded under the ticker PTITF.
We've gathered analysts' opinions on PT Indosat Tbk future price: according to them, PTITF price has a max estimate of 0.20 USD and a min estimate of 0.12 USD. Watch PTITF chart and read a more detailed PT Indosat Tbk stock forecast: see what analysts think of PT Indosat Tbk and suggest that you do with its stocks.
PTITF reached its all-time high on Jul 16, 2007 with the price of 1.9800 USD, and its all-time low was 0.0275 USD and was reached on Dec 20, 2018. View more price dynamics on PTITF chart.
See other stocks reaching their highest and lowest prices.
See other stocks reaching their highest and lowest prices.
PTITF stock is 12.83% volatile and has beta coefficient of 1.53. Track PT Indosat Tbk stock price on the chart and check out the list of the most volatile stocks — is PT Indosat Tbk there?
Today PT Indosat Tbk has the market capitalization of 4.22 B, it has decreased by −6.67% over the last week.
Yes, you can track PT Indosat Tbk financials in yearly and quarterly reports right on TradingView.
PT Indosat Tbk is going to release the next earnings report on Apr 24, 2026. Keep track of upcoming events with our Earnings Calendar.
PTITF earnings for the last quarter are 0.00 USD per share, whereas the estimation was 0.00 USD resulting in a 6.72% surprise. The estimated earnings for the next quarter are 0.00 USD per share. See more details about PT Indosat Tbk earnings.
PTITF net income for the last quarter is 115.34 M USD, while the quarter before that showed 75.13 M USD of net income which accounts for 53.53% change. Track more PT Indosat Tbk financial stats to get the full picture.
Yes, PTITF dividends are paid annually. The last dividend per share was 0.01 USD. As of today, Dividend Yield (TTM)% is 3.77%. Tracking PT Indosat Tbk dividends might help you take more informed decisions.
As of Feb 14, 2026, the company has 4.2 K employees. See our rating of the largest employees — is PT Indosat Tbk on this list?
EBITDA measures a company's operating performance, its growth signifies an improvement in the efficiency of a company. PT Indosat Tbk EBITDA is 1.66 B USD, and current EBITDA margin is 49.05%. See more stats in PT Indosat Tbk financial statements.
Like other stocks, PTITF shares are traded on stock exchanges, e.g. Nasdaq, Nyse, Euronext, and the easiest way to buy them is through an online stock broker. To do this, you need to open an account and follow a broker's procedures, then start trading. You can trade PT Indosat Tbk stock right from TradingView charts — choose your broker and connect to your account.
Investing in stocks requires a comprehensive research: you should carefully study all the available data, e.g. company's financials, related news, and its technical analysis. So PT Indosat Tbk technincal analysis shows the neutral today, and its 1 week rating is buy. Since market conditions are prone to changes, it's worth looking a bit further into the future — according to the 1 month rating PT Indosat Tbk stock shows the buy signal. See more of PT Indosat Tbk technicals for a more comprehensive analysis.
If you're still not sure, try looking for inspiration in our curated watchlists.
If you're still not sure, try looking for inspiration in our curated watchlists.