We might push higher then dropThere is a possibility for this guys to shoot and test that trendline before they could start going down
CMHC/HPPU50_BC trade ideas

#ALGOUSDT #ALGOCOIN Trade setup: Appears on a verge of breaking out from a Sideways Channel ($0.25-$0.35), but needs to be confirmed by breaking above 200-day moving average as well. If confirmed, price could rally up to $0.50 resistance. (set a price alert).
Trend: Uptrend on Short- and Medium-Term basis and Downtrend on Long-Term basis.
Momentum is Bullish ( MACD Line is above MACD Signal Line and RSI is above 55).
OBV (On Balance Volume): is rising, indicating that volume on Up days is greater than volume on Down days. Hence, demand (buyers) exceeds supply (sellers).
Support and Resistance Nearest Support Zone is $0.25. The nearest Resistance Zone is $0.35, which it broke, then $0.50 and $0.70.

antusd BINANCEUS:ANTUSD
looks positive breaking through . stop loss is important
not a financial advice.

Inflation Rate of the G20 countriesThe G20 is made up of the world's 19 largest economies, represented by the finance ministers and heads of central banks, plus the European Union, represented by the European Central Bank and the rotating presidency of the European Council.
This graph shows the inflation of these countries month over month (MoM).
Source:
tradingeconomics.com

Bitcoin: Number of Large Transactions increasingIntoTheBlock labels the large transactions those where an amount greater than $100,000 USD was transferred.
In this case, the Number of Large Transactions indicator aggregates the total number of transactions that had a value greater than $100,000.
The number of large transactions is a relevant metric tracking the count of transactions greater than $100,000.
Since this sum of money is not available to the average retail trader on-chain, the indicator acts as a proxy to the number of whales’ and institutional players’ transactions.
More info: resources.intotheblock.com
An increase in the quantity of these large transactions is accompanied by an increase in price.
This indicator follows a symmetrical triangle, tending to break up.
Perhaps there is one last bear trap to finally reverse into an uptrend.

BTC Open Interest has broken through resistanceBitcoin price was half asleep.
It seems that now the dormant volcano has woken up.
Overview
Open interest is a traditional term used to quantify the total dollar value of investors' positions in a futures contract.
These positions can be long or short. For example, imagine that the Bitcoin futures contract has just opened and Alice buys $100.
At this point, both volume and open interest equal $100. So Alice decides she wants to sell her half of her position.
Therefore, by closing half of the market's open positions, open interest decreases to $50, while volume increases to $150.
Open interest aggregates all positions and gives traders an idea of the dollar value that is at stake for a given contract.
For perpetual swaps, open interest can be held for an indefinite period, while for futures contracts, open interest reaches zero the moment a contract expires and usually starts to decline a few weeks before the settlement date.
How can I use it?
Similar to volume, open interest can be used to gauge trend strength.
For example, if open interest increases as the price increases, this indicates that more longs are being opened.
On the contrary, if prices increase and open interest rates decrease, it points to the weakening of the trend as derivatives traders' positions are being closed.
Therefore, the example above points to strong conviction among perpetual swap traders as the amount of open positions has increased along with the price of Bitcoin.
Source:
resources.intotheblock.com

LiveWire LVW EV Motorcycle Company SPAC Blank Checkran across this in a Michael Burry article.
Transaction net proceeds of $545 million* will fund LiveWire's strategic plan to accelerate its go-to-market model, invest in new product development, and enhance global manufacturing & distribution capabilities
- LiveWire will benefit from industry-leading strategic partners - Harley-Davidson and KYMCO, a leading global powersports company headquartered in Taiwan - by leveraging their engineering expertise, manufacturing footprint, distribution, supply chain infrastructure and global logistics capabilities
- LiveWire pro forma enterprise value of approximately $1.77 billion
- Harley-Davidson and ABIC to Host a Joint Conference

INTOTHEBLOCK - best data tools for Crypto traders and investors
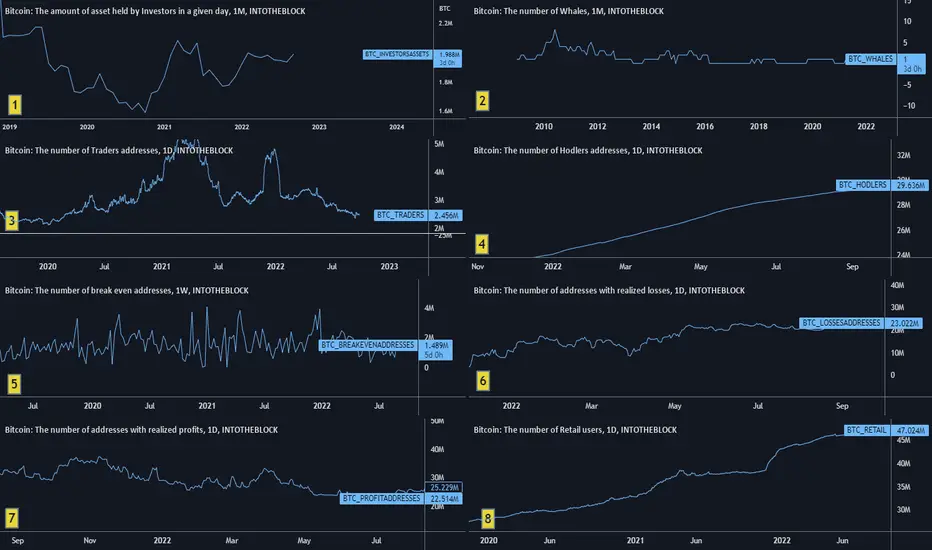
I am so excited with new Tradingview data offering from INTOTHEBLOCK and DEfiLlama. I am an Intotheblock user for a while, and I am going to describe on short, some benefits that you can get from their data. Please note that the interpretation over price expectation are personal opinions, and might be different than what INTOTHEBLOCK suggest in some occasions. I strongly advise that you should make your own research over the information or data you get, and how to interpret them.
There is so much data where you can have access now, but I have chosen only 8 charts with different data, and I am going to provide some brief personal interpretation over them, together with a link to INTOTHEBLOCK official website related to my charts, from where you can see educational and informational description over the data they are providing.
1. The amount off asset hold by investors - An investor is defined as and address holding between 0,1% and 1% from total coin supply.
Personal opinion: An increase in these numbers are seen as positive, with a potential increase in the price, while a decrease, is the opposite.
Link to more info - resources.intotheblock.com
2. The number of whales – Address with over 1% from the total coin supply. At the moment you can see only 1 address holding over 1%.
Personal opinion: Together with BTC price increase, it will be more and more difficult to see addresses with over 1%, but if BTC will fall down, lets say under 10k, we might see more 1% addresses, which will be a positive sign.
Link to more info- resources.intotheblock.com
3. The number of traders addresses - All the addresses with average holding period of under 1 month are considered, traders addresses.
Personal Opinion: An increase in traders addresses, is a positive signal, while a decrease is a negative.
Link to more info - resources.intotheblock.com
4. The number of holders addresses – It refers to addresses that are holding the coin for a period of over 1 year.
Personal opinion: People needs to sell in order to cash out profits, so increase in holding addresses, it means that actual market price is not considered good for cashing out in profit, but it might be a good time to become a holder.
Link to more info - resources.intotheblock.com
5. Number of break even address – Addresses that are not making money at BTC actual price,, but they are not loosing also.
Personal opinion: These reflects the actual market situation, at the current every day price. Less BE addresses at lower price is positive, than high number of BE at higher prices. This is because if they are many addresses BE at higher prices, a collapse might come if price falls down. If you look at this chart and at BTC chart, you will see that BTC entered a bear market with the last high concentration of BE addresses, around November last year.
Link to more info - resources.intotheblock.com
6. Number of addresses with realized loses – This is a simple out of the money definition.
Personal opinion: A good indication over market sentiment in relation with market reality. As example If the price of BTC is falling, and this graphic is increasing, than it might be a good indication that bulls are loosing, and you might want to be a seller.
Link to more info- resources.intotheblock.com
7. Number of addresses with realized profit – This is a simple in to the money definition.
Personal opinion: If this graphics is increasing, and the price of BTC is falling, than is a signal that sellers are making money, and you might want to be also a seller.
Link to more info - resources.intotheblock.com
8. Number of retail users – This are addresses with less than 0.1% from the coin supply.
Personal opinion: Retail users are the majority of the addresses, and an increase in number of users, I consider to be a good positive indicator for long term investing. I call this, the popularity indicator.
Link to more info - resources.intotheblock.com
Don’t stumble trading. Trade safe!
LINKUSDTThe more drawn out the collection the more grounded the breakout !!
We can see Cup&handle design inside flat aggregation range
Best methodology here is purchasing after breakout/retest above obstruction region
Best of wishes

Why my trade failed?Spot buying a long bias on LDO. Range-reclaim on support is the setup. Entr based on invalidation was the entry technique.

Quick money (if done right)When the relevance strength index reach each other then the price of the share will act opposite to what it has been just doing.

BOND/USD 2 MORE DAYS WE SHOULD SEE ANOTHER BOND BUMP UPBond is consolidating Zleven days up Zeven days down. 7/11 or un till 11/7 will reach a peak of 49.14. Stay tuned same bat time same bat channel. Loooonnnngggrrraaannngggeee but could pop any time.


WTI and Brent crude oil break out of swing zoneWTI and Brent crude oil break out of swing zone
In case you forgot, crude oil prices are still at astronomical prices.
As of writing, WTI futures are trading at $114 per barrel, while Brent crude futures are trading at $117 per barrel.
Over Thursday trading, both assets loaded more than 3% onto their already elevated prices. Higher prices are being driven by strong oil demand, while tight supplies and oil embargoes threatening further obstacles for the industry are not abating.
According to the Bank of America Global Research report, oil inventories across the US and Europe are at “Dangerously low” levels. The report went on to warn that its prediction for Brent oil to be priced on average at $102 per barrel over 2022 and 2023 is now questionable. As of writing, the 20, 50, and 200 day moving average is at $110, $108, and $90 per barrel, respectively.
Factors that the report cites include a downturn in oil demand as global economic condition worsen (particularly in Europe and the UK), and the EU finally coming to an agreement to ban Russian oil. The latter issue is being held up by Hungary, which is requesting almost a billion dollars to upgrade its oil refineries before agreeing to restrict Russian oil imports into Europe.
With Thursday’s price rises, both WTI and Brent futures have both decisively broken out of a recent swing area on the hourly chart. In the case of WTI, the instrument spent most of its time in the top half of the $108.00 to $112.00 range, dating back to May 19. The last time the price broke above this range was on May 16, reaching a peak just above $115 per barrel, but this break-out could only be sustained for 2 days before succumbing to selling pressure.


A de-SPAC to Dodge
Last Closing Price: $9.83
50-Day Simple Moving Average: $9.84
Volume Weighted Average Price: $9.83
Relative Strength Index: 45.76
20-Day Average Daily Volume: 54,865
Shares Outstanding: 43,125,000
Available Borrow: 200,000
Borrow Fee Rate: 2.11%
Squared Equity Management L.P. is an investment adviser whose affiliates have sponsored two SPACs: G Squared Ascend I Inc. ( NYSE:GSQD ) and G Squared Ascend II Inc. ( NYSE:GSQB ). In dual IPOs last year, the blank-check companies raised $300,000,000 and $125,000,000, respectively, on the promise that their shared management team–which also manages G Squared Equity Management–would conduct a diligent search for attractive acquisition targets in the tech industry.
The team didn’t have to look far. In Sep. 2021, G Squared Ascend I announced a plan to merge with Transfix, Inc., which is a privately held logistics technology company whose existing shareholders just happen to include an affiliate of G Squared Equity Management. In other words, the investment adviser scoured the world and found no better merger target than one that lets it get liquid on one of its affiliate’s holdings. The proposed merger would value Transfix at $1,100,000,000.
The prospectus for G Squared Ascend I portrays the SPAC’s managers as seasoned venture capitalists who have funded high-profile tech startups such as Airbnb, Inc. ( NASDAQ:ABNB ), Lyft, Inc. ( NASDAQ:LYFT ), and Spotify Technology SA ( NYSE:SPOT ). But G Squared’s managers weren’t among the Silicon Valley elite who got to invest in those companies before anyone had heard of them.
Rather, G Squared acquired more than 70% of its investments on the secondary market. That is, the firm bought shares secondhand from early investors and employees who wanted to exercise their stock options and cash out–perhaps to put a down payment on a house or to send a kid to college. There’s nothing wrong with that. But if you think investing in a G Squared SPAC amounts to getting in early on the next Airbnb or Lyft, you may want to read further.
What’s in a name?
Several entities that bear the G Squared moniker used to have the acronym GSV in their names. Before that, many of them used to carry the brand name Gentry–as in Gentry Financial Holdings Group, LLC, which was founded in Chicago in 2008 by G Squared’s chairman, Larry Aschebrook. As the name implies, Gentry Financial Holdings Group was a holding company for several financial services businesses, including a securities brokerage named Gentry Securities, LLC. Aschebrook was a licensed broker with Gentry Securities until he ran into some trouble.
In 2013, an investor allegedly purchased an interest in a fund affiliated with Gentry Securities that failed to raise capital, according to records in FINRA’s BrokerCheck database. The investor claimed that Gentry owed him principal, fees, and warrants, and he demanded damages of $720,000. In a written response submitted to FINRA, Aschebrook said the complaint was inaccurate and that no assurances were made to the investor that the fund would raise all the money it required. The investor ultimately withdrew the complaint.
However, in the same year the complaint was lodged, an investor named Michael Bromiley sued Aschebrook, Gentry Capital Advisors, Gentry Financial Holdings, and an investment vehicle named Gentry-Solexel Investment, LLC, which Gentry Securities had sold to investors in a private offering . The vehicle held shares of Solexel, Inc. (a.k.a. Beamreach Solar, Inc.), which was a privately held solar tech startup in Milpitas, CA. The company allegedly raised $250,000,000 from investors before filing for Chapter 7 bankruptcy in 2017. The lawsuit against Aschebrook and Gentry continued into 2015 before the parties settled on undisclosed terms.
In the same year the settlement was reached, another investor who had purchased interests in multiple investment vehicles affiliated with Gentry Securities alleged that the brokerage had made misrepresentations, had failed to disclose conflicts of interest, and had sold him unsuitable investments, according to BrokerCheck . He demanded damages of $236,713. Aschebrook and Gentry’s successor settled for $140,000. In a written response submitted to FINRA, Aschebrook said the complaint was inaccurate and that the investor had understood what he was getting into.
Reboot, Rebrand, Repeat
Before the complaints and the lawsuit were resolved, Aschebrook shut down Gentry Securities and moved on to a brokerage in Tampa, FL named Harbor Light Securities, LLC, according to BrokerCheck . He picked up where he had left off, using Harbor Light to sell private placements of funds managed by Gentry affiliates. Four months after he joined Harbor Light, Aschebrook’s holding company, Gentry Financial Group, announced that it was changing its name to GSV Financial Group and was giving its affiliates new names beginning with GSV. The company had licensed the GSV brand, which stands for Global Silicon Valley, by entering into an agreement with an investment adviser in Woodside, CA named GSV Asset Management, LLC, which became a sub-adviser to GSV Financial Group’s funds.
Not all was harmonious inside GSV Asset Management. In Dec. 2014, a co-founder of the investment adviser, Stephen Bard, sued his fellow managers. Among his beefs were allegations that the other executives had sought to dilute his ownership in the firm by surreptitiously forming and funding competing entities, including the renamed Gentry companies. Bard’s complaint alleged that his co-founder Michael Moe had grown resentful after Bard complained about Moe’s use of the firm’s funds to finance personal debts, an exorbitant lifestyle, and “lascivious non-business expenses.” Bard did not prevail in the lawsuit.
Through the rebranded GSV entities, Aschebrook intensified his practice of buying secondary shares of established tech startups, transferring the shares into funds, and selling interests in the funds via private placements. Regardless of how the funds performed, a GSV entity usually received a percentage of assets under management as a fee. Some of the funds–such as those that held shares of Airbnb, Lyft, and Spotify–generated handsome returns after the issuers went public. But other funds disappointed–particularly those that held shares of startups in which GSV entities had invested directly. Two such funds owned shares of Aquion Energy, Inc., which filed for Chapter 11 bankruptcy in 2017 after GSV Ventures (née Gentry Venture Partners) had offered investors over $21,000,000 of interests in funds that held the company’s shares.
Birth of a SPAC
By the time Aquion Energy had restructured its debts and sold off assets, GSV Financial Group had already undergone another name change. The holding company’s flagship investment adviser, GSV Equity Management, LLC, was rechristened G Squared Equity Management L.P. and began raising new funds under the G Squared brand name. In 2019, a Cayman Islands affiliate of the adviser named G Squared Ascend Management I LLC acquired 761,607 shares of preferred stock at $10.49 per share in a Series D financing of Transfix, Inc.–which brings us back to the SPAC named G Squared Ascend I, Inc.
The SPAC went public on Feb. 8, 2021. As is customary with a blank-check company, the prospectus for G Squared Ascend I stated that the company had not identified a merger target as of the date of the IPO. But the prospectus also disclosed that G Squared Ascend I was not prohibited from pursuing a merger with a business that was affiliated with its sponsor, officers, or directors. On May 16, 2021, while said officers and directors were presumably hunting for a company to take public, a venture capital fund they managed named G Squared V, L.P. agreed to purchase up to $50,000,000 of convertible notes from Transfix. Under the terms of the purchase agreement, the notes are convertible into common stock of Transfix upon closing of a merger with a SPAC. Thus the managers of G Squared Ascend I had even more to gain from a combination with Transfix.
For the first nine months of 2021, Transfix reported unaudited revenue of $208,125,000, which represented a 73% increase from the first nine months of 2020. Although the top-line growth was impressive, the company’s thin gross profit margin of 5.7% barely budged from the same period in the prior year. For the nine months ended Sep. 30, 2021, Transfix reported unaudited operating and net losses of $26,446,000 and $28,173,000, respectively. The company is developing technology that aims to do for trucking what Uber and Lyft did for passenger transportation. But the cost that Transfix pays a carrier to move a load is its largest expense and one over which it has limited control.
A year ago, investors were valuing companies like Transfix on a multiple of projected revenue. But how fast the market has changed. Suddenly, a $1,100,000,000 valuation for a company that barely squeaks out a gross profit looks like a stretch. Add to that the obvious conflicts of interest and mixed track record of the SPAC sponsor, and G Squared Ascend I may be a de-SPAC to short–if a de-SPAC occurs.

TASE:TOEN Tomer Energy Royalties 2012 ltd - holds right to royalties of oil and gas explorations. Real energy (oil and gas) exploration.
Return on Equity:
2020: 11.9 %
2021: 4.4 %

Are you prepared for what's next?Long-term cycle analysis shows we are already past the end of an Appreciation Cycle Phase. This means the global markets are shifting into a Depreciation Cycle Phase (similar to the unraveling of credit/debt in 2006~09.
If you have not already prepared for this, you need to start thinking about what the next 5 to 7+ years are going to look like and how you need to protect your assets.
I know what I'm doing RIGHT NOW in preparation for this deflationary price cycle. Asset and Commodity prices have already spiked to multi-year highs. Capital is flowing away from China/Asia, and parts of Europe, as continued credit/debt and consumer/economic factors contract.
You better believe, at some point, these trends will be reflected in the US markets - they just have not shown up right now.
The FED may change all that THIS YEAR. So, don't say I didn't warn you.
I'm ranking this as NEUTRAL related to US Major Market Trends. Things could go either direction over the next 6+ months, but I see more downside risk than upside opportunity right now.
Follow my research.

Vaneck Vector Steel ETF USA Sun Storm Investment Trading Desk & NexGen Wealth Management Service Present's: SSITD & NexGen Portfolio of the Week Series
Focus: Worldwide
By Sun Storm Investment Research & NexGen Wealth Management Service
A Profit & Solutions Strategy & Research
Trading | Investment | Stocks | ETF | Mutual Funds | Crypto | Bonds | Options | Dividend | Futures |
USA | Canada | UK | Germany | France | Italy | Rest of Europe | Mexico | India
Disclaimer: Sun Storm Investment and NexGen are not registered financial advisors, so please do your own research before trading & investing anything. This is information is for only research purposes not for actual trading & investing decision.
#debadipb #profitsolutions

SPELLBNBPossible cup and handle pattern on the daily chart of spellbnb and spelltry pairs. Not so clear in the usdt pair but it's there. Hopefully something good comes of it soon 🚀 🚀 🚀 🚀.

Strong trend line seen in GICI was going through some trades from this year and I saw this symbol. I made some money on it but I completely forgot who it was! I then remembered this used to go by the ticker SYS and I remember they offered this "bonus" one time dividend that was like 1 dollar a share or something awesome. Anyways, check the lower trend line. It has been respected time and time again. I've been watching this for the last few days looking for confirmation. The volume going into close warrants a further look next week. My gut was telling me to take a nibble this morning and look! It went straight up later in the afternoon. My price target for the short term is 38.50
This is not advice or a direction to take positions in any financial instrument. Good old fashioned entertainment! Everyone is responsible for their own trades and strategies, please do your own DD and plan each of your trades accordingly! GLTA
First idea post in Trading View :)

buy oppourtunity you should not missgood target profit with small stop loss
Good luck
Please do proper risk managemenrt according to your portoflio
recommend 2% only by professional
Follow me for more interesting ideas

Cargo M3 Holdings LongWhat I see
Cup and Handle formation starting from 2020
Fib retracement from the start of the impulse wave. 618 already reached
Weekly momentum increasing
I really see this is a long term buy. It has seen a brutal down trend which seems to be turning around. Money is flowing back into the stock, there are more buys then sells. If South Africa recovers I see this stock doing very well.
