mtl usdt break out signal very risky break out from descending channel on 4 hr time frame mtl is highly profitable coin with very high profits in the future
LME/PR_NI trade ideas


Voxies VOXEL price has prospects for growthVoxies is a relatively young coin that has not yet seen a price increase, only a drop throughout 2022.
Voxel is another gaming token that has finally begun to show growth step-by-step with: MANA, SAND, GALA, and even AXS with SLP)
So, if you believe that gaming tokens and NFTs have good prospects in the crypto world, you should probably take a closer look at Voxies (VOXEL)
However, it is worth considering that the price of VOXELUSDT on high volumes is coming to the wide range of $0.32-0.62 . In this liquidity zone, those who bought VOXEL 6–9 months ago and continued to sit in a drawdown will definitely sell it at "zero", as human psychology is so organized.
But the "tasty" zone for buying VOXEL for medium- and long-term investment is in the range of $0.18-0.23
_____________________
Did you like our analysis? Leave a comment, like, and follow to get more


US CONSUMER SPENDING IS INFLATION A GOOD THING ? The posted is that of the US Consumer where are the funds coming from ?? no down turn YET. in each of the down turns looking at the chart in 1973/1974 ,1980/1982 , 1990/1991, ,2000/2002, 2007/2009 2023/2024 We had very clear BEAR MARKETS . once the spending turned down it lasted from 17 to 22 months

Sectors that ended positive in 2022 downwards trendWe saw Oil & Gas production and services companies outperformed the market overall. We also metals and mining including Gold ending positive and a slighthly positive result for Healtcare; Insurance and Defense sectors.

TESTING NEW ENTRY TECHNIC #10All ten are in place for them crypto.
I will also start looking for the 10th position.
On Forex,
10 more stock, metal, and index positions
And do a comparison between all those markets.
to determine which market this entry strategy works best in.
I will also share it here.

Large Holders Netflow vs Bitcoin Price📝Overview
IntoTheBlock classifies addresses based on their holdings the following way:
🐋Whales: Addresses holding over 1% of a crypto-asset’s circulating supply.
🐬Investors: Addresses holding between 0.1% and 1% of circulating supply.
🐟Retail: Addresses with less than 0.1% of circulating supply.
In most cases, any holder with over 0.1% of circulating supply of a large cap crypto-asset holds a substantial amount of funds.
Therefore, Large Holders Netflow measures the amount of inflows minus outflows pertaining to these addresses.
Spikes in netflow can be seen as accumulation from large players, while drops point to reduced positions or selling.
(Source: IntoTheBlock)
📈Analysis
Analyzing the Netflow graph of Bitcoin, Ether and main stable coins, we have an exit peak on 📅June 19, 2022, made in USDT, as shown in the green circle.
The resistance created on this day needs to be broken to confirm a bullish scenario in Bitcoin price.

Trader addresses vs Bitcoin price 📝Definitions
According to IntoTheBlock , we can classify bitcoin addresses by the amount of time they have held their investments.
The classification is done by looking at the weighted average time an address has been holding, split into three groups:
🧑🦳Hodlers — Addresses that have been holding for over one year. These are seen as long-term investors
🧑Cruisers — Addresses holding for over a month but under a year. These are mid-term or so-called swing traders
🧑🦲Traders — Addresses holding for under a month. These are short-term speculators
📈Graphic analysis
There is a positive correlation between the number of traders and the Bitcoin price most of the time.
It is interesting to note that the number of traders is at the same level as July 2019, while the Bitcoin price is in the same zone as the 2017 top.
🟢The scenario will be bullish if the number of traders break through the blue rectangle and seek the upper part of the symmetrical triangle;
🔴on the other hand, the scenario will be bearish if this indicator seeks the bottom of the triangle.
⚠️And it would be extremely bad if it broke the triangle below.
📆This week promises a lot of volatility, with US inflation data being released on 12/13/2022, and on the 14th the interest rate release, along with the FOMC projections.
🇪🇺 In addition there will be a hectic agenda in the European Union.

Cruisers Addresses vs Bitcoin Price... This is a complementary study of this idea:
🧑Cruisers: addresses holding for over a month but under a year. These are mid-term or so-called swing traders.
📈The correlation is positive most of the time with the price of Bitcoin.
🐢However, when looking closely at this indicator, we can see that it has a strong characteristic of a lag indicator (a delayed indicator).
⏳ I'm waiting for this indicator to reach 10 million or if there will be a reversal, to conclude on something.
🎂 And to conclude, December 17, 2022 will be the 5th anniversary of the top of 2017...
--------
ℹ️ Clarification: The moving average plotted on the chart is 8 weeks or 55 days (exponential smoothed)

DFI.money YFII price grew against the market trendYour attention is a chart of YFIIUSDT on the 3-day time frame.
The first thing that catches your eye is that the value of YFII has grown +1200% in less than six months . And this is at a time when the entire crypto market is falling.
We could not find a logical or technical explanation for such an abnormal increase in the price of YFII, and even tried to find a news background, but all in vain)
Therefore, it is most likely a dangerous manipulation of a low-liquid coin. And only a few will make money on such price manipulation, and the majority of those who will fall for the provocation will pay the "organizers" for it.
However, if you know the reason why the price of DFI.Money (YFII) has grown so much, write in the comments below the idea.
The second thing that catches the eye is that a bearish "Shooting Star" pattern has formed on the 3-day time frame
The minimum target of this pattern is $1500, and the maximum is $1200.
So, if you know what kind of project it is and believe in the further growth of the YFIIUSD price, then the first balanced purchase is possible in the range of $1200-1500
And you can also put orders for $850 and $570 - there was an abnormal growth, and there may be the same abnormal falls. Everything is possible in the crypto world.
We do not buy YFII yet, but we will gladly read comments from you with thoughts and information about DFI.money (YFII)
_____________________
Did you like our analysis? Leave a comment, like, and follow to get more

FTX and the end of an eraThe fall of FTX will go down in history as something similar to the crash of 2008.
On Friday, 11/11/2022, a court-supervised reorganization was requested, the first step towards filing for bankruptcy.
In this chart, we can see the balance of assets belonging to the hodlers of the FTT token, used on the FTX exchange.
Surreptitiously, on September 26, someone with inside information already knew the boat was going to sink.
And these managed to get a lifeboat before everyone else...
This can be proven by comparing the same type of chart in other cryptocurrencies, where nothing absurdly out of the ordinary is noticed:
BTC
ETH
AAVE
ADA
BUSD (Binance)
COINEX
Curve
dYDX
GUSD (Gemini)
HT (Huobi)
HUSD (Huobi)
KCS (Kucooin)
CRO
Polygon
Magic Internet Money
OKB (OKX)
QuickSwap (Polygon)
USDC
USDT
-------------------------
Another indicator that demonstrates the problem to come is the Volume of transactions with a value of $100,000 or greater in USD .
On FTX’s FTT token, there was a strangely unusual volume, ahead of other cryptocurrencies:
FTT
BTC
ETH
USDC (note that high volume happened just days later, in the desperation of multiple withdrawals and moves)
-------------------------
The Amount of asset held by Whales is another indicator that I bring here to compare some exchanges, but not all of them are available.
FTT (FTX)
BUSD (Binance) (this information does not exist for BNB)
Coinex
CRO
dYDX
GUSD (Gemini)
HT (Huobi) (⁉️)
HUSD (Huobi)
KCS (Kucoin)
OKB (OKX)
USDK (OKX)
Uniswap
Better times will come.

We might push higher then dropThere is a possibility for this guys to shoot and test that trendline before they could start going down

#ALGOUSDT #ALGOCOIN Trade setup: Appears on a verge of breaking out from a Sideways Channel ($0.25-$0.35), but needs to be confirmed by breaking above 200-day moving average as well. If confirmed, price could rally up to $0.50 resistance. (set a price alert).
Trend: Uptrend on Short- and Medium-Term basis and Downtrend on Long-Term basis.
Momentum is Bullish ( MACD Line is above MACD Signal Line and RSI is above 55).
OBV (On Balance Volume): is rising, indicating that volume on Up days is greater than volume on Down days. Hence, demand (buyers) exceeds supply (sellers).
Support and Resistance Nearest Support Zone is $0.25. The nearest Resistance Zone is $0.35, which it broke, then $0.50 and $0.70.

antusd BINANCEUS:ANTUSD
looks positive breaking through . stop loss is important
not a financial advice.

Inflation Rate of the G20 countriesThe G20 is made up of the world's 19 largest economies, represented by the finance ministers and heads of central banks, plus the European Union, represented by the European Central Bank and the rotating presidency of the European Council.
This graph shows the inflation of these countries month over month (MoM).
Source:
tradingeconomics.com

Bitcoin: Number of Large Transactions increasingIntoTheBlock labels the large transactions those where an amount greater than $100,000 USD was transferred.
In this case, the Number of Large Transactions indicator aggregates the total number of transactions that had a value greater than $100,000.
The number of large transactions is a relevant metric tracking the count of transactions greater than $100,000.
Since this sum of money is not available to the average retail trader on-chain, the indicator acts as a proxy to the number of whales’ and institutional players’ transactions.
More info: resources.intotheblock.com
An increase in the quantity of these large transactions is accompanied by an increase in price.
This indicator follows a symmetrical triangle, tending to break up.
Perhaps there is one last bear trap to finally reverse into an uptrend.

BTC Open Interest has broken through resistanceBitcoin price was half asleep.
It seems that now the dormant volcano has woken up.
Overview
Open interest is a traditional term used to quantify the total dollar value of investors' positions in a futures contract.
These positions can be long or short. For example, imagine that the Bitcoin futures contract has just opened and Alice buys $100.
At this point, both volume and open interest equal $100. So Alice decides she wants to sell her half of her position.
Therefore, by closing half of the market's open positions, open interest decreases to $50, while volume increases to $150.
Open interest aggregates all positions and gives traders an idea of the dollar value that is at stake for a given contract.
For perpetual swaps, open interest can be held for an indefinite period, while for futures contracts, open interest reaches zero the moment a contract expires and usually starts to decline a few weeks before the settlement date.
How can I use it?
Similar to volume, open interest can be used to gauge trend strength.
For example, if open interest increases as the price increases, this indicates that more longs are being opened.
On the contrary, if prices increase and open interest rates decrease, it points to the weakening of the trend as derivatives traders' positions are being closed.
Therefore, the example above points to strong conviction among perpetual swap traders as the amount of open positions has increased along with the price of Bitcoin.
Source:
resources.intotheblock.com

LiveWire LVW EV Motorcycle Company SPAC Blank Checkran across this in a Michael Burry article.
Transaction net proceeds of $545 million* will fund LiveWire's strategic plan to accelerate its go-to-market model, invest in new product development, and enhance global manufacturing & distribution capabilities
- LiveWire will benefit from industry-leading strategic partners - Harley-Davidson and KYMCO, a leading global powersports company headquartered in Taiwan - by leveraging their engineering expertise, manufacturing footprint, distribution, supply chain infrastructure and global logistics capabilities
- LiveWire pro forma enterprise value of approximately $1.77 billion
- Harley-Davidson and ABIC to Host a Joint Conference

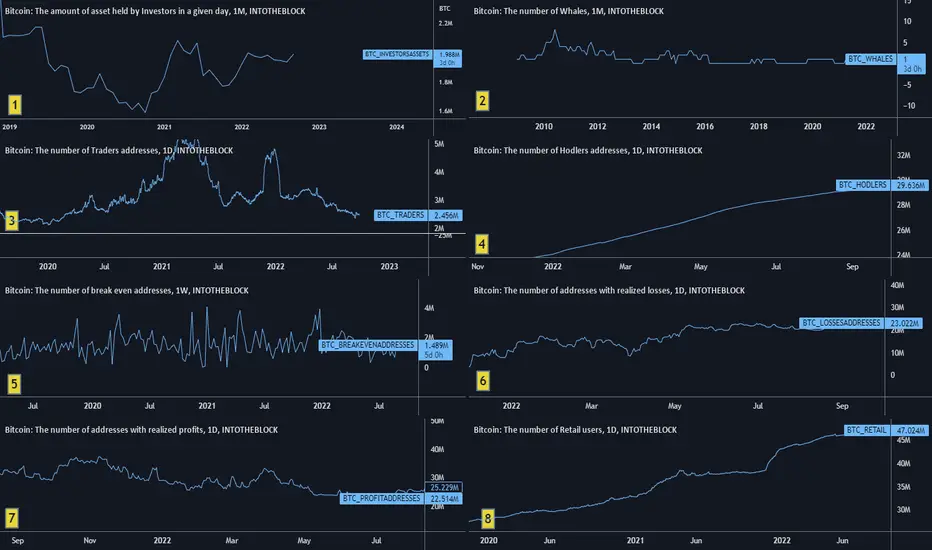
INTOTHEBLOCK - best data tools for Crypto traders and investors
I am so excited with new Tradingview data offering from INTOTHEBLOCK and DEfiLlama. I am an Intotheblock user for a while, and I am going to describe on short, some benefits that you can get from their data. Please note that the interpretation over price expectation are personal opinions, and might be different than what INTOTHEBLOCK suggest in some occasions. I strongly advise that you should make your own research over the information or data you get, and how to interpret them.
There is so much data where you can have access now, but I have chosen only 8 charts with different data, and I am going to provide some brief personal interpretation over them, together with a link to INTOTHEBLOCK official website related to my charts, from where you can see educational and informational description over the data they are providing.
1. The amount off asset hold by investors - An investor is defined as and address holding between 0,1% and 1% from total coin supply.
Personal opinion: An increase in these numbers are seen as positive, with a potential increase in the price, while a decrease, is the opposite.
Link to more info - resources.intotheblock.com
2. The number of whales – Address with over 1% from the total coin supply. At the moment you can see only 1 address holding over 1%.
Personal opinion: Together with BTC price increase, it will be more and more difficult to see addresses with over 1%, but if BTC will fall down, lets say under 10k, we might see more 1% addresses, which will be a positive sign.
Link to more info- resources.intotheblock.com
3. The number of traders addresses - All the addresses with average holding period of under 1 month are considered, traders addresses.
Personal Opinion: An increase in traders addresses, is a positive signal, while a decrease is a negative.
Link to more info - resources.intotheblock.com
4. The number of holders addresses – It refers to addresses that are holding the coin for a period of over 1 year.
Personal opinion: People needs to sell in order to cash out profits, so increase in holding addresses, it means that actual market price is not considered good for cashing out in profit, but it might be a good time to become a holder.
Link to more info - resources.intotheblock.com
5. Number of break even address – Addresses that are not making money at BTC actual price,, but they are not loosing also.
Personal opinion: These reflects the actual market situation, at the current every day price. Less BE addresses at lower price is positive, than high number of BE at higher prices. This is because if they are many addresses BE at higher prices, a collapse might come if price falls down. If you look at this chart and at BTC chart, you will see that BTC entered a bear market with the last high concentration of BE addresses, around November last year.
Link to more info - resources.intotheblock.com
6. Number of addresses with realized loses – This is a simple out of the money definition.
Personal opinion: A good indication over market sentiment in relation with market reality. As example If the price of BTC is falling, and this graphic is increasing, than it might be a good indication that bulls are loosing, and you might want to be a seller.
Link to more info- resources.intotheblock.com
7. Number of addresses with realized profit – This is a simple in to the money definition.
Personal opinion: If this graphics is increasing, and the price of BTC is falling, than is a signal that sellers are making money, and you might want to be also a seller.
Link to more info - resources.intotheblock.com
8. Number of retail users – This are addresses with less than 0.1% from the coin supply.
Personal opinion: Retail users are the majority of the addresses, and an increase in number of users, I consider to be a good positive indicator for long term investing. I call this, the popularity indicator.
Link to more info - resources.intotheblock.com
Don’t stumble trading. Trade safe!
LINKUSDTThe more drawn out the collection the more grounded the breakout !!
We can see Cup&handle design inside flat aggregation range
Best methodology here is purchasing after breakout/retest above obstruction region
Best of wishes

Why my trade failed?Spot buying a long bias on LDO. Range-reclaim on support is the setup. Entr based on invalidation was the entry technique.

Quick money (if done right)When the relevance strength index reach each other then the price of the share will act opposite to what it has been just doing.
