RLCUSDTIn this trade I'm looking for long position with sl/tp as u can see in the screen
I'm using in my idea as usual Fibo + Resis/supp levels
This is not financial advice - Trading is risky
If U like my ideas don't forget to follow me )
RLCUSDT.P trade ideas

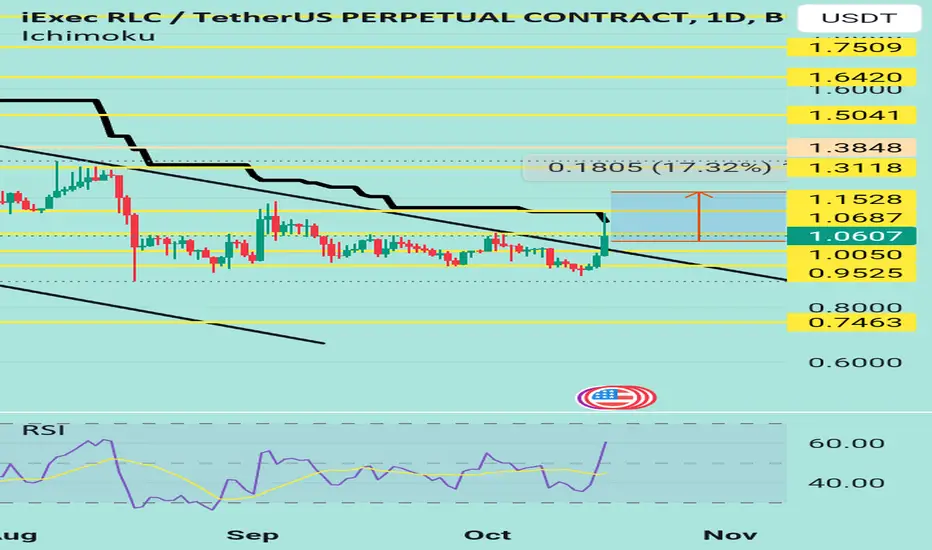
RLCUSDT Long/Short... an IDEAThe Chart is simple n going as per the BTC movement
i expect at least a 15% upwards...
NAFA n DYOR...
These are just IDEAs...
ThankYou ...
* NB( IDEAz means, a point of act, u should consider that token and DYOR n If u feel if my views are good, then Long/Short)
* NB : (i am a bull i never short, but its my TagLine...)

RLC/USDT Need to Break the pattern to continue Upward Movement💎 RLC has certainly garnered our interest. Currently positioned in a pivotal zone, RLC needs to overcome the constraints of the falling wedge pattern and breach the supply zone to ignite a bullish surge.
💎 A successful disruption of these barriers could pave the way for RLC's ascent towards the resistance level. Historical trends highlight RLC's repeated setbacks upon encountering this resistance, underscoring the critical nature of this threshold for facilitating a smooth advance towards further supply zones or even the Bearish OB territory.
💎 Conversely, if RLC falters in its attempt to shatter the pattern and penetrate the supply realm, it may face a reversal, prompting a retreat to the demand zone for momentum recalibration. This scenario necessitates a robust rebound from RLC to avert a descent through the demand layer, which could otherwise precipitate a slide towards more profound support foundations.

RLCUSDT IDEAHello Trading view Family / Fellow Traders.
I hope you have used and benifited from the previous analysis .
In today trading session we are monitoring RLCUSDT for a buying opportunity...
RLCUSDT UPDATE
Formed Falling Wedge & Breaking Out Incase Of Successful Breakout Expecting 25% Profit So far💥

RLCUSDTHello snipers, on a one-day time frame, we see the price of RLCUSDT close to the upper line of its long-term descending channel. If the price breaks and stabilizes, we can expect the price to rise to the upper resistances. nothing is impossible. Analyzing this is only a possibility and not a buy or sell.
finally rlc breaking out seems like getting ready for massive recovery formed text book falling wedge in daily timeframe and breaking out expecting successful breakout soon incase of successful breakout expecting 100 to 120% bullish rally
keep eyes on for successful breakout

RLCUSDTRLCUSDT was trading under declining trendline and recently it seems like the sellers are bit exhausted then bulls took the charge and break through declining trendline.
Currently the price has given the breakout from falling trendline and now forming a local support around 1.01 region.
Will the bulls take charge again continue for leg higher?

RLC 10x setup Don't Sleep 💤 Hold .83c L@@K!!! Not financial advice
Trade moving forward.
Short term ups and downs to be expected.
Again .83c is the number to hold.
There is no rush on this token
Only number we care about is holding .83c
Once that is verified it's game on.
But here is a beautiful setup brewing on RLC and one of the cleaner setups moving forward
Plenty of room to move down
But no fears
Holding .83c even on the downturn is key.
You can see once we flip 2.17 into support we knock out that whole big trading area and apply the same % move from bottom to top of almost 1000% so we can theoretically have a target of 21.00 long term.
Always DYOR
Remember to PIK
#Patience Is Key
And always
#TLAW

@RLC - 15% move, you dont wanna miss@RLC - 15% move, you dont wanna miss
Trend line breakout, ongoing retest.

RLC/USDT Potential Break the pattern ?? Bullish Momentum for RLCYello Paradisers, RLC Analysis: A Strong Bounce and Bullish Signs
💎 RLC experienced a significant bounce after touching the Bullish Order Block (OB) area. This zone also coincides with the support trendline of a falling wedge pattern. After consolidating for a few days, RLC surged yesterday.
💎 The recent candle close displayed a strong green candle, indicating high potential for RLC to break through both the supply zone and the falling wedge pattern's resistance. If this breakout is successful, it could signal a bullish momentum for RLC, with the likelihood of continuing its upward trajectory.
💎 Invalidation Scenario: This bullish outlook would be negated if RLC retraces back to the Bullish OB area, breaks it, and closes below it.

Rlc Preparing For Move Towards 3$Seems Like Getting Ready For Massive Recovery
Formed Falling Wedge In Daily Timeframe & Approaching Towards Trend line To The Upside In case Of Breakout Expecting Move Towards 3$
( Incase Of Successful Breakout Expecting 150%+ Bullish Rally)

RLCUSDT is inside a descending channelRLCUSDT trading pair, a distinctive pattern has emerged in the form of a descending channel. This channel is a reflection of the market's current behavior, where the price movements are delineated by a consistent series of lower highs and lower lows. Such a pattern can often be indicative of a prevailing downtrend within the market.
The descending channel, in this case, finds its definition between two prominent daily structures. These structures serve as the upper resistance and lower support trendlines of the channel, confining the price within this well-defined corridor. The upper resistance trendline is formed by connecting the consecutive lower highs, while the lower support trendline is established by connecting the successive lower lows.
Market observers and traders are keenly observing this descending channel, as it can provide valuable insights into the market's direction and potential future movements. The channel's confines offer a visual representation of the market's tendency to favor downward movements, providing a reference for understanding potential price fluctuations.
Of particular interest is the anticipation of a possible breakout from this descending channel. If the price were to breach the upper resistance trendline according to Plancton's trading rules, a new long position might be considered. Plancton's approach emphasizes the importance of confirmation and adherence to specific criteria before entering a trade.
To act in accordance with Plancton's rules, traders are advised to:
Confirmation: Wait for a clear and sustained breakout above the upper resistance trendline. This involves observing the price's ability to remain above the trendline and confirming the move with supporting factors like volume increase.
Technical Indicators: Utilize technical indicators such as moving averages, oscillators, and trend confirmation tools to gauge the strength of the potential breakout.
Risk Management: Implement effective risk management strategies, including setting stop-loss levels and position sizing. This helps mitigate potential losses in case the breakout doesn't materialize as expected.
Patience: Exercise patience and wait for a definitive confirmation before entering a trade. False breakouts can lead to losses, so it's important to be cautious.
Market Context: Consider the broader market context and any relevant news or events that might impact the breakout.
–––––
Follow the Shrimp 🦐
Keep in mind.
🟣 Purple structure -> Monthly structure.
🔴 Red structure -> Weekly structure.
🔵 Blue structure -> Daily structure.
🟡 Yellow structure -> 4h structure.
⚫️ Black structure -> <= 1h structure.
Follow the Shrimp 🦐

RLCUSDTHello Traders,
As we can see in the chart after a long bullish transversal now we can open a short position in RLCUSDT we can expect a little bearish transversal follow chart pattern to open a position.

RLC Bullish ZONERLC/USDT
Entry : 1.125$ - 1.102$
TP : 1.200$ - 1.300$ - 1.439$
SL : 1.014$ (After Entry 2)

#RLC/USDT - Long - Potential 6.91%Direction: Long
Market: Spot
Risk: 0.25% - 1%
#USDT_RLC
Exchange: BINANCE
Timeframe: 360
TP1: 1.285
Entry: 1.203
STOP: 1.121
Entry Conditions:
| Falling wedge breakout
| Volume confirmation
| Bullish overhead pivot

RLC LOOKS BEARISH (1D)Hi, dear traders. how are you ? Today we have a viewpoint to SELL/SHORT the RLC symbol.
For risk management, please don't forget stop loss and capital management
When we reach the first target, save some profit and then change the stop to entry
Comment if you have any questions
Thank You

RLCUSDT potential reversal with a 50% growth potentialRLCUSDT is currently hovering around a significant support area, and the recent price action indicates that this support level has been respected. This could potentially signal a reversal in the price direction, particularly if the support continues to hold strong. As a result, we identify a compelling buying opportunity in RLCUSDT, with a potential growth potential of 50%.

RLCUSD Bulls in Action💎 Very soon, we might witness a strong growth opportunity for #RLCUSDT, especially after a clean bounce off the support. A few weeks back, #RLC demonstrated a remarkable bounce off multiple support indicators, including the uptrend trendline, 23.6% Fibonacci support, and Volume Profile. This highlights the immense strength of the $1.00 psychological demand level, being a crucial price mark to watch.
💎 As long as #RLC remains above this level, bulls are likely to continue driving the price higher, presenting significant upside potential. It's essential to monitor two key resistance levels: the first being the double Fibonacci at $1.84, and the second at $2.60, representing a 38.2% Fibonacci retracement level and a major supply zone.
💎 Therefore, we anticipate a minimum 80% price increase, with the potential for an impressive 155% rise for #RLC. This presents a solid risk-reward buying opportunity for mid to long-term traders. However, it's important to note that achieving the final target may require patience, as it could take weeks, if not months, for the price to reach its destination.
Paradisers, pay close attention as this promising setup unfolds🌴!

RLC ANALYSIS (1H)Hi, dear traders. how are you ? Today we have a viewpoint to SELL/SHORT the RLC symbol.
For risk management, please don't forget stop loss and capital management
When we reach the first target, save some profit and then change the stop to entry
Comment if you have any questions
Thank You

RLCUSDT is testing the key level!
RLCUSDT is a trading pair that represents the price of RLC (iExec) in relation to USDT (Tether). The recent price action of RLCUSDT has displayed a notable pattern known as a falling wedge. This pattern is characterized by a contracting range between downward-sloping resistance and support lines. A breakout from this pattern is regarded as a bullish signal.
After a previous false breakout around the $1.2 area, RLCUSDT has now successfully broken out from the falling wedge pattern. This breakout indicates a potential shift in market sentiment and a possible reversal in the downtrend. However, it's worth noting that the market is currently testing a resistance level around the $1.5 area on the 4-hour timeframe.
According to Plancton's Rules, a new trading opportunity may arise if RLCUSDT manages to secure new liquidity and undergoes a breakout from the current resistance level. This breakout would indicate a strengthening bullish momentum in the market. Traders following Plancton's Rules might consider opening long positions once the breakout is confirmed.
–––––
Follow the Shrimp 🦐
Keep in mind.
🟣 Purple structure -> Monthly structure.
🔴 Red structure -> Weekly structure.
🔵 Blue structure -> Daily structure.
🟡 Yellow structure -> 4h structure.
⚫️ Black structure -> <= 1h structure.
Follow the Shrimp 🦐


rlcConsidering that we are in the mid-line of the channel, if I want to buy in the medium term, the first three lines are for the buying range, and if I want to check the long-term, the last three lines are green. The first is the roof of the channel and the next stage is the red lines

✴️ iExec RLC 1,2,34 Steps PatternA new bullish wave is about to develop on the RLCUSDT trading pair based on the 1,2,3,4 Steps Pattern.
We have a strong long-term higher low, Nov. '22 vs June '23, and the rest is obvious...
Well, not really obvious but I described this pattern several times on the TOTAL index chart, BTCUSD and many Altcoins.
The entire Cryptocurrency market is set to experience #4, a new bullish wave.
Namaste.
