RNDR BULLISH LONG IDEAS RNDR last bottom zone is $ 6 for me and I think I will buy from there if it falls. I think these two scenarios will develop, stay tuned. fibonacci levels are very important.
RNDRUSDT trade ideas

RNDR momentumRNDR one of the higher momentum tokens over the last year had a major sell off and wicked to my downside target which is the prior cycle high. RNDR reaches for the momentum trend (teal line) on this reversal. I updated a fib extension and I wouldnt be surprised to see 9$ soon. The BTC halving is very close and we should see some BTC stabilization above 60k although brief moments below are possible.
-My next profit take is 20$
-Then 40$ I will sell most of my position and leave a small moon bag

RNDR/USDT bullish horizons from demand? 👀🚀RNDR analysis💎 Paradisers, let’s focus on #RNDRUSDT. It’s currently positioned within a demand zone and approaching key resistance at $8.284. If the price manages to break above this level, we can anticipate a strong bullish move.
💎 In our previous observations, CRYPTOCAP:RNDR has consistently followed a descending trendline, respecting it twice. With the current assessment near the key resistance of $8.284, there’s a high probability that the price will break through this level, especially considering it’s also trading within the demand zone, further strengthening the bullish scenario.
💎 However, a word of caution: if the price of #RNDR fails to maintain its momentum within the demand zone and dips below, we anticipate a bullish rebound from the lower Bullish Order Block level at $5.962. Thanks to ample liquidity, breaking below this level could cause a significant downward move1.
💎 Remember to employ prudent trading strategies and use proper stop-loss measures! Stay alert to market movements and look forward to more insights
MyCryptoParadise
iFeel the success🌴

RNDRUSDT IDEAHello Traders Hope You Are Enjoying Our Analysis. Today We Will Discuss About RNDR
(Update)
On The Verge Of Massive Breakout Formed Ascending Channel Incase Of Successfully Breakout Expecting Massive Bullish Wave⚡️

RNDR Price Surge Alert! 📈 - Your Path to Wealth Starts Here**Technical Analysis Chart Description:**
Welcome to my Technical Analysis charts on TradingView! Before we dive into the analysis, it's essential to understand some important warnings:
1. **Subjectivity Alert:** Technical analysis involves interpreting market data and chart patterns, which can be subjective. Different analysts may interpret the same data differently, leading to varied conclusions.
2. **Historical Performance Doesn't Guarantee Future Results:** Past price movements do not guarantee future price movements. While historical data can provide insights, it's crucial to consider other factors that could influence price action.
3. **Risk of False Signals:** Technical indicators and chart patterns can produce false signals, leading to potential losses if relied upon blindly. Always cross-verify signals with other indicators or fundamental analysis.
4. **Market Volatility:** Crypto markets are highly volatile and can experience rapid price fluctuations. Be prepared for sudden and unexpected price movements, which may invalidate previously identified patterns.
5. **Risk Management:** Proper risk management is essential. Never invest more than you can afford to lose, and consider using stop-loss orders to mitigate potential losses.
6. **Emotional Bias:** Avoid emotional decision-making based on short-term price movements. Stick to your trading plan and strategy, and don't let fear or greed influence your decisions.
**Disclaimer for Crypto Trading:**
Trading cryptocurrencies carries inherent risks, and it's important to understand the following:
Cryptocurrency markets are highly speculative and can be subject to extreme volatility. Prices can fluctuate significantly within short periods, leading to substantial gains or losses.
Investing in cryptocurrencies involves the risk of total loss of capital. Unlike traditional assets, cryptocurrencies are not backed by any tangible assets or central authority, making them inherently risky.
Regulatory uncertainty and market manipulation are additional risks associated with cryptocurrency trading. Regulatory changes or negative news can have a significant impact on prices.
This analysis is for informational purposes only and should not be construed as financial advice. It's crucial to conduct thorough research and consult with a qualified financial advisor before making any investment decisions in the cryptocurrency markets.
By using this analysis, you acknowledge and accept the risks associated with cryptocurrency trading and agree to trade at your own discretion. The author of this analysis shall not be held responsible for any losses incurred as a result of using the information provided.

RNDRUSDT IDEAHello Trading view Family / Fellow Traders.
I hope you have used and benifited from the previous analysis .
In today trading session we are monitoring RNDRUSDT for a buying opportunity,
RNDRUSDT UPDATE
Forming Bullish Pennant in 6H Time frame✴️
Breakout can expect 65-70% Bullish move 📈🚀

RNDR: wait for confirmation📊Analysis by AhmadArz:
🔍Entry: 7.792 - 7.237
🛑Stop Loss: 6.420
🎯Take Profit: 8.736 -9.743 -10.761 -11.915 -12.590
🔗"Uncover new opportunities in the world of cryptocurrencies with AhmadArz.
💡Join us on TradingView and expand your investment knowledge with our five years of experience in financial markets."
🚀Please boost and💬 comment to share your thoughts with us!

RNDRUSDT(Render Token) Daily tf Range Updated till 15-04-24RNDRUSDT(Render Token) Daily timeframe range. compare to other alts and market plunge. its holding not bad. need to break 10.014 to reclaim older zone above that is price discovery. breaking 6.764 will led it to 3.651.

RNDRUSDT IDEAHey traders hope you are enjoying our analysis. Now we are here again with a new trading opportunity. We will discuss today about RNDR
RNDR Falling Wedge Formation in Weekly Timeframe✍️
In case Of Breakout,Expecting
50% Bullish Wave🚀

RNDR/USDT planning for bullish move? 👀 🚀 RNDR Today analysis💎 Paradisers, let’s delve into the #RNDRUSDT analysis! An intriguing shift has occurred as it breaks free from its descending channel, setting the stage for an exciting potential bullish surge.
💎 Over an extended period, #RNDR has meticulously traced the contours of a descending channel. Currently, the price is testing a critical support level at $7.947. Our confidence in its ability to embark on a bullish trajectory remains steadfast, challenging the overhead resistance.
💎 However, prudent preparation is crucial: should the price dip below the pivotal support zone, we may witness a pronounced bearish downturn. In such a scenario, our focus shifts to anticipating a bullish rebound from the lower support level at $6.541.
💎 Remember to employ sound trading strategies and implement proper stop-loss measures! Stay vigilant, monitor market movements, and eagerly await further insights.
MyCryptoParadise
iFeel the success🌴

Long Trade Position RNDRUSDTTest your analytical skills in the tradingview simulator with virtual money to become a professional. In spot trading, I will specify the entry points, loss limit and profit limit for you! The conditions for entering the trade and our strategy are as follows, when you notice that the market trend is increasing and at least two green candles close above the entry point in fifteen minutes, you can enter the trade from the beginning of the third green candle. Be patient and don't rush to enter! After the price reaches the first target, move your stop loss below the first profit limit so that if the price reverses, your trade will be closed with profit. Repeat the above strategy to continue the price targets shown on the chart. If the price reaches or falls below our loss limit before the above condition, entering this transaction is invalid because it must be re-analyzed and the new entry, loss and profit limits must be determined. Note that the market trend is formed with clever tricks by the market maker, so even the most powerful analyzes may be invalidated. The only thing we can do is to surf the waves and stick to our strategy so that while taking care of our capital, Let's make a profit. These exercises will make you experience profit and loss with virtual money in the real market and improve your analysis and personal strategy. Know your fear and greed and gradually control them so that your business becomes profitable and you suffer less loss.

$RNDR CRYPTOCAP:RNDR PRZ at 6.77 hit, wicks formed, consolidation expected, might also see further downside.
had some longshot buy limits on several cryptos that i didn't really expect to be hit coz everyone's just too bullish...

RNDR (Y24.P1.E1).MACRO targetsHi Traders,
Lets see at the end of this bull run, how accurate was this forecast.
I would not put much weight on what I'm doing here as its for my interest only to see later on what worked and what didn't in terms of using fibonacci and some assumptions.
The minimum I expect is BASE 3 for a parabolic chart, and Base 4 stage would be mega bullish.
****
IF HOWEVER we get it perfect, not to say I will, then it makes a great case to short the level I said it might reach.
Other charts of a similar nature can be found, like FTM
All the best,
S.SAri

RNDR 12/04/2024Patience is the key, RNDR has entered the levels that we anticipated. Now we need to start buying. There is one important thing, 7.945 was our all time high. If go lower from this level it might trigger the deviation since this chart is a bigrange

RNDR LONG SETUPCRYPTOCAP:RNDR play when we take back SSL as support...
Patience...
#trading
@rendernetwork

rndrSupport and press the rocket to cheer me up
Observe the ten percent loss limit
Stay away from Bitcoins
Feel free to buy and sell and post your comments
Render Double BottomRender Double Bottom. Bouncing off resistance. Price target previous ATH 53% up.
Could take a few weeks to play out.

#RNDRUSDT Monthly Chart Projection The RNDRUSDT pair is currently in a consolidation phase, with the price trading around $2.20 USDT.
According to the MACD indicator, which shows a bearish crossover signal, there is potential for the pair to continue its downward trend in the short term.
The RSI indicator is currently neutral, suggesting that the pair is not overbought or oversold at the moment.
The 20-day and 50-day EMAs are currently below the current price, indicating a short-term bearish trend. However, the 200-day EMA is above the current price, indicating a long-term bullish trend.
If the RNDRUSDT pair breaks and stays below the support level around $1.40 USDT, it could potentially enter into a stronger bearish trend. In this scenario, the pair could reach the next support level around $1.00 USDT.
Alternatively, if the RNDRUSDT pair breaks and stays above the resistance level around $3.00 USDT, it could potentially enter into a bullish trend again. In this scenario, the pair could reach the next resistance level around $4.00 USDT.
It's important to consider other market factors, such as economic news and ongoing global events, to assess potential price movements for the RNDRUSDT pair on a monthly chart.

Buy now at the beggining of the breakout, or ......wait to see if the market retests support on the line, after the CPI and PPI data is released this week.
The best approach depends on your investment goals, risk tolerance, and market outlook.
I would not recommend using a leverage higher than 3 for this trading pair.

RNDRUSDT - Continuation IdeaAn idea suggesting a pullback to a strong horizontal level then price proceeding onward with the bull movement
The bars pattern plotted is how I think price action will play out.
AI coin

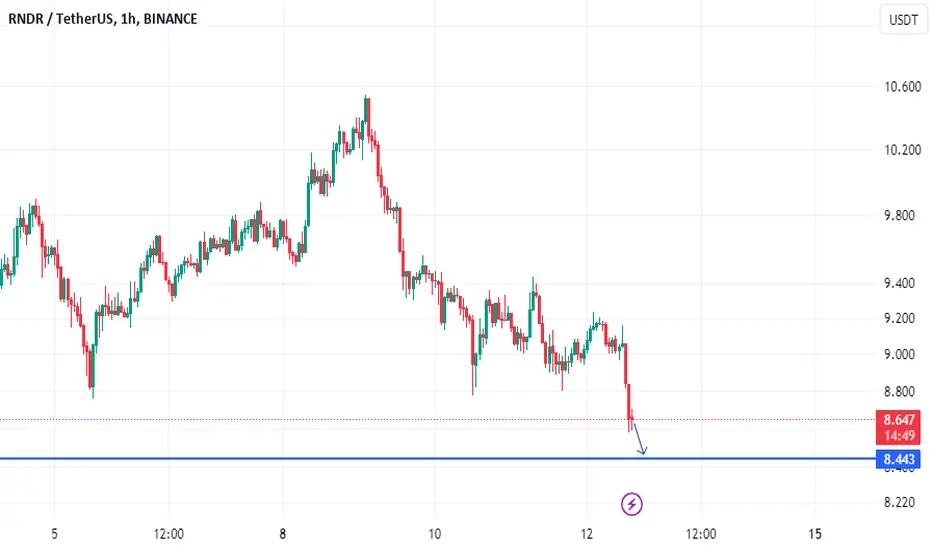
RNDR finding footingRNDR is finding footing on a new weekly fib extension I have drawn. The momentum trend is around 8.6$ as well. A bottomed stochastic, uncertain markets lead to high volatility. Remember, many people yelled at me when I took a sliver of profits with RNDR and INJ pumping obnoxiously, and here we are in bloody times. I will admit even I am not enjoying this dip and I love dippertunities. Medium term I think RNDR visits 14$.
-My next sell target is 20$ for 25% of my position, the funds are already on Coinbase.
-My long term target remains 40$ based on network expansion I will sell all but my remaining 25%.
-Dont marry your bags, moon bags are fine but we are here to try to outperform BTC

RNDR - accumulationRNDR/USDT: upward pennant, which indicates a continuation of an upward trend after a consolidation phase. Key levels to watch are $8.68 (support) and $13.81/$17.60 (resistance). Volume is decreasing, which is common in this pattern. The RSI is neutral at 57.54. Traders might wait for a breakout above the pennant with increased volume to consider a long position, using a stop-loss below the pennant's lower trendline for risk management. Remember to consider other factors like market sentiment and news.

