RSRUSDT IDEAHello Traders Hope You Are Enjoying Our Analysis. Today We Will Discuss About RSR
(Update)
The Falling Wedge Has Breakout On Weekly Timeframe☑️
Expecting Profit Is +600% In Coming Days⚡️
RSRUSDT trade ideas

==== RSRUSDT UPDATE ^^^^#RSRUSDT
Hey dear members hope you all are enjoying our ideas and analysis. Now we are here to discuss about RSR
RSR has breaked the main Falling Wedge Pattern. We can see gain here upto 80%+ in this move ✍

RSR/USDT It shows bouncing this can be a good sign for upward!💎 Paradisers, #RSR is indeed a coin worth monitoring closely.
💎 With a bullish candle rejection observed on the LTF demand area at 0.00568, there's potential for a bullish reversal. If RSR successfully backtests the resistance at 0.077, it could indicate a strengthening bullish sentiment.
💎 Breaking above the key supply area at 0.00916 would further solidify this bullish momentum, potentially paving the way for RSR to reach our target strong resistance area.
💎 However, if RSR fails to bounce from the LTF demand area, there's a possibility of a retracement towards the Major demand area around 0.0052 - 0.0048. Historical data suggests that RSR has exhibited consistent bounces from this zone, often leading to significant upward movements.
💎 The bullish scenario would be invalidated if the daily candle closes below the Major demand area. Such a development would signal a bearish momentum, potentially leading to further downward movement for RSR.
MyCryptoParadise
iFeel the success🌴

RSR Long Trade Quiet Money PrinterThis has recently touched fresh liquidity and is about to retest that zone. I entered earlier and was hoping to get to add more to my position at or below my entry since I took some profits out at the last HH. This trade has many possibilities for different types of traders. My plan is simple and I will trade in and out at the resistance levels until there is a strong breakout to the upside. This is a long term play to hit the main target if possible and this was planned on a weekly chart. You can see the daily IPDA operating range marked on the daily chart which is the one I am posting here. The weekly makes it obvious why I feel this token is going to explode in the future. If you are using leverage you might want to trade it in smaller sections with tighter SL. Personally I am buying SPOT and just closed out my short as you can see from the other trade before this. I am also adding a grid bot to offset any losses. I will also be building a long position with 3-5 times leverage when I see a strong uptrend begin.
-NFA and this is a little known token, but it is more then meets the eye. #DYOR and always book profits cause most of the time there will always be a place to add back if you so chose to do so. Good luck this trade seems like a real profit generator. I almost hate to share it because for some reason all the trades I post privately are very successful and the ones I post public tend to have more problems.
May everyone earn some good profits on upcoming trades... I see a lot of possibilities just have to be patient.

RSR/USDT 4HOUR CHART UPDATE !!Welcome to this quick RSR/USDT analysis.
I have tried my best to bring the best possible outcome in this chart.
RSR has broken out of the symmetrical triangle pattern, indicating potential upside momentum. MA 50 confirms a bullish trend, which supports a buy setup.
the explanation:
RSR, in its recent price action, has broken out of a symmetrical triangle pattern. This breakout pattern often suggests a continuation of the previous trend, potentially leading to higher prices.
Furthermore, the Moving Average 50 (MA 50) is indicating a bullish trend. The MA 50 is a widely used technical indicator that tracks the average closing prices of an asset over the last 50 periods. When the current price is above MA 50, it indicates bullish sentiment in the market.
Taking these technical signals together, there is a setup for a potential buying opportunity in RSR/USDT. Traders and investors may consider entering long positions expecting further growth in the price of RSR.
However, like any trading setup, it is essential to conduct a thorough analysis, consider risk management strategies, and closely monitor market developments.
Remember:-This is not a piece of financial advice. All investment made by me is at my own risk and I am held responsible for my own profit and losses. So, do your own research before investing in this trade.
Do hit the like button if you like it and share your charts in the comments section.
Thank you...

RSR ANALYSIS🔮 #RSR Analysis - Breakout 🚀🚀
💲💲 There is a breakout of Falling Wedge Pattern in #RSR and perfectly retests the level. It's a 8hr time frame breakout and we will see more higher price in long-term.
💸Current Price -- $0.006722
📈Target Price -- $0.008678
⁉️ What to do?
- We have marked crucial levels in the chart . We can trade according to the chart and make some profits. 🚀💸
#RSR #Cryptocurrency #Breakout #DYOR

RSRUSDT IDEAHello Trading view Family / Fellow Traders.
I hope you have used and benifited from the previous analysis .
In today trading session we are monitoring RSRUSDT for a buying opportunity,
RSRUSDT UPDATE
#Rsr is ready for a good bullish wave after successful breakout in this move we can see price around 0.0097$💸 soon in coming days✅

RSRUSD 1WRSR ~ 1W
#RSR Make Purchases gradually in the Demand zone. with a minimum target of 20%+. This is a Support zone that needs to be retested for further upside.

RSRUSDT IDEAHey traders hope you are enjoying our analysis. Now we are here again with a new trading opportunity. We will discuss today about RSR
RsR THE Bullish flag Breakout has already Done in 4H Timeframe ✅
Expecting 70%Bullish wave in Coming day's 🚀

#RSR/USDT is heading towards the Diagonal Trendline in 4-Hour TF#RSR/USDT is heading towards the Diagonal Trendline in 4-Hour TF!
#RSRUSDT needs to break PWH $$0.00693 and Trendline as a support to gain Bullish momentum. The local support level is PW: $$0.005435.

RESERVED RIGHT (RSR) MORE CONTEXT
On the daily timeframe analysis I talked about how we might be seeing 170% gain coming weeks but then I want to call your attention to the possible right entry here.
The supposed wave 3 on the daily timeframe might be 5 because the Fibonacci Extension to that point is 300% which I would say is over extended for a wave 3 as opposed to the 168% and if 200% which in this case we got.
So I am considering this new bearish price action to be the beginning of a larger degree wave 2. meaning BINANCE:RSRUSDT on midterm is bearish and we will have to wait for price to drop further down before entering.

RSRUSDT IDEAHey traders hope you are enjoying our analysis. Now we are here again with a new trading opportunity. We will discuss today about RSR
RSR THE Bearish Flag Breakout has already Confirmed in 3H Timeframe ✅
Expecting +20%Bullish wave in Coming day's 🚀

RSRUSDT Buy opportunityRsrusdt has recently experienced a significant breakout from a falling wedge pattern. This breakout suggests a strong bullish sentiment and presenting potential trading opportunities.
We have identified a strategic buy back area on the chart, which presents an optimal opportunity for re-accumulation of the coin.
Targets for profit-taking have been outlined on the chart, ranging from immediate to final setup targets. These levels serve as potential exit points.
In the event of a price retracement, a robust demand zone has been identified to act as a strong support level, potentially preventing significant downside movement.
It is essential for us to exercise caution and implement effective risk management strategies. This includes setting moderate stop-loss levels to mitigate potential losses and adhering to sound money management principles.
Your insights and opinions on this coin are welcomed for further discussion.

$rsr HTF bottom | big volumethere are very few charts out there that look as clean as RSR does on the weekly. huge volume cluster at the lows. 30x back to the highs and this could easily run much higher.
ATH market cap was just over $5B.. $180MM market cap currently. Think at peak bull this could run to $+50B.


RSR looks a rocketThe slightly lower RSR has formed a solid support zone. This coin is in a bullish wave C. In fact, we are now in the middle of a bullish wave C.
If a pullback is made to the green range, it is a buying opportunity.
The target is clear on the chart.
Closing a daily candle below the invalidation level will violate the analysis
For risk management, please don't forget stop loss and capital management
Comment if you have any questions
Thank You

RSR ANALYSIS🔮 #RSR Analysis - Both Side Scenario 🚀🚀
💲💲 #RSR is trading in a Descending Triangle Pattern. If the price of #RSR breaks and sustain the higher price then will see a pump and if the price breakdown the channel then we would see a dump📈📉
⁉️ What to do?
- We have marked crucial levels in the chart . We can trade according to the chart and make some profits. 🚀
#RSR #Cryptocurrency #Support #Resistance #DYOR

Rsr chartRsr chart. This is done using an experimental method. This is not financial advice. Heavy resistance is the one that usually rejects the bull run. To sustain the move up you have the diagonal support line (if it`s not broken than the up movement is still valid). Alternatively it can hit support brake the diagonal support but still go to reach targets.

POC support from 2022This is a POC level I found and marked up from May of 2022. With many test as resistance after that, I am hoping to see this hold as support. As of this posting, it has provided immediate support on the flush down, but we shall see if any real volume can come in here to push it higher. A breakout does depend on the broader market. BTC consolidation is great. BTC breakout is amazing.


Reserve Rights $RSR going parabolicRSR absolutely crushing it this past week and still not even at macro resistance yet.
Question is, do we see some consolidation first before another god-like candle?
I don't think this thing sees green again for a long time.
The train has left the station.
Vatsik

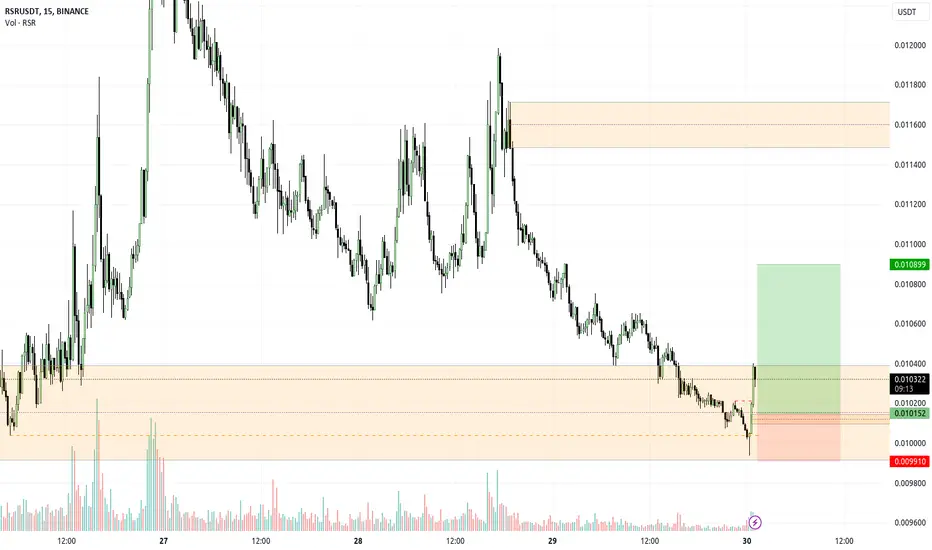
RSRUSDT(Reserve Rights) Daily tf Range Updated till 27-03-24RSRUSDT(Reserve Rights) Daily timeframe range. another beast of a performance from this one. the amount of profit provided from this one level by level is impressive. 0.012928 holding up for now, a retrace is make sense. local retrace point is at 0.009749.
