RUNEUSDT This is my possible set up on RUNEUSDT hopefully BTC won’t spoil the set up for usdt
Entry matters
DCA WOULD BE NICE TOO BUT USE LOW LEVERAGE THE JOURNEY IS FAR
Success all traders
RUNEUSDT.P trade ideas

big move coming?potential morning star at the bottom of a zone. tell me what you guys think we are also at the bottom of the Bollinger band.

rune great longbig liquidity zone we are in now you can see it goes back a couple weeks now. resistance turned into support. this looks like a gigantic falling wedge to me we just broke and are came back down to accumulate more. 4 hr chart i see a massvie cup and handle. low rsi and mac d finally turning white on the 1 day makes me believe we are in a re test liquidity grab stage before we moon. next couple days weeks should be massive upside in my opinion.

RUNEUSDT still on ShortYou can take profit with Rune on this descending channel until it reach 7.17 price market or around 0.618 fibonacci level.

RUNEUSD Can grow by mor than 36% nowRUNEUSD Can grow by mor than 36% now
price cross up and pullback to 'SMA200 Daily'

💡Don't miss the great buy opportunity in RUNEUSD @THORChain
Trading suggestion:
". There is a possibility of temporary retracement to the suggested support line (6.642).
. if so, traders can set orders based on Price Action and expect to reach short-term targets."
Technical analysis:
. RUNEUSD is in an uptrend, and the continuation of the uptrend is expected.
. The price is above the 21-Day WEMA, which acts as a dynamic support.
. The RSI is at 51
Take Profits:
TP1= @ 8.06
TP2= @ 8.88
TP3= @ 9.90
TP4= @ 11.68
TP5= @ 13.47
SL= Break below S2
❤️ If you find this helpful and want more FREE forecasts in TradingView
. . . . . Please show your support back,
. . . . . . . . Hit the 👍 LIKE button,
. . . . . . . . . . Drop some feedback below in the comment!
❤️ Your support is very much 🙏 appreciated! ❤️
💎 Want us to help you become a better Forex / Crypto trader ?
Now, It's your turn !
Be sure to leave a comment; let us know how you see this opportunity and forecast.
Trade well, ❤️
ForecastCity English Support Team ❤️

💡Don't miss the great buy opportunity in RUNEUSD @THORChain
Trading suggestion:
". There is a possibility of temporary retracement to the suggested support line (6.642).
. if so, traders can set orders based on Price Action and expect to reach short-term targets."
Technical analysis:
. RUNEUSD is in an uptrend, and the continuation of the uptrend is expected.
. The price is above the 21-Day WEMA, which acts as a dynamic support.
. The RSI is at 54.
Take Profits:
TP1= @ 8.06
TP2= @ 8.88
TP3= @ 9.90
TP4= @ 11.68
TP5= @ 13.47
SL= Break below S2
❤️ If you find this helpful and want more FREE forecasts in TradingView
. . . . . Please show your support back,
. . . . . . . . Hit the 👍 LIKE button,
. . . . . . . . . . Drop some feedback below in the comment!
❤️ Your support is very much 🙏 appreciated! ❤️
💎 Want us to help you become a better Forex / Crypto trader ?
Now, It's your turn !
Be sure to leave a comment; let us know how you see this opportunity and forecast.
Trade well, ❤️
ForecastCity English Support Team ❤️

Scalping strategy signalsCombined with the MacD Indicator with Multiple Time Frames, the KayeDinero Trendsetter is a useful tool for scalping (works best for 5min or 15min timeframes)

Head & Shoulder patternRune is forming a head and shoulder pattern to break the POI where my trendline intercepts my support. I expect price to buy for a short period of time and sell to complete the pattern


$RUNE:The expected scenario HELLO GUYS
The expected scenario based on the previous and repeated original trend.
- At the beginning, we notice that the price is moving within a descending triangle, which is a negative pattern.
The price touched the falling trend line at three tops (B,D,F).
And the main support line in three also (A, C, E).
- Every time after reaching the descending trend line, a top forms, then a lower bottom, then a lower corrective top, then a lower bottom, and so on until the main bottom is reached at the original support line, then rebounds to reach the next top.
-All of this happens in complete agreement with the stochastic movement, which is almost identical to the price movement.
-Today, we have the first bottom after the top, and it is heading to form a lower corrective top.
-Would he complete in a similar way?
-I have charted a potential path similar to what happened previously.
This analysis may be wrong or right, and is not investment advice.

RUNE 1D : Looks Strong Against BitcoinHello Everyone, If You Like The Idea You Can Support With A Like And Comment .
Point Of View ❗
My current look on markets are bearish but market makers loves to feel you stupid every time so I'm preparing bullish scenarios also to have flexibility .
Keep In Mind ❗
Depends on bitcoin price im going to buy rune from spot . Its really bullish against bitcoin so we need to track bitcoin to get perfect entry .
Important : Please Use RM (Risk Management) and MM (Money Management) If You Decide To Use My Ideas, There Will Always Be Unprofitable Ideas, This Will Definitely Happen, The Goal Of The System Is That There Will Be More Profitable Ideas At A Distance.

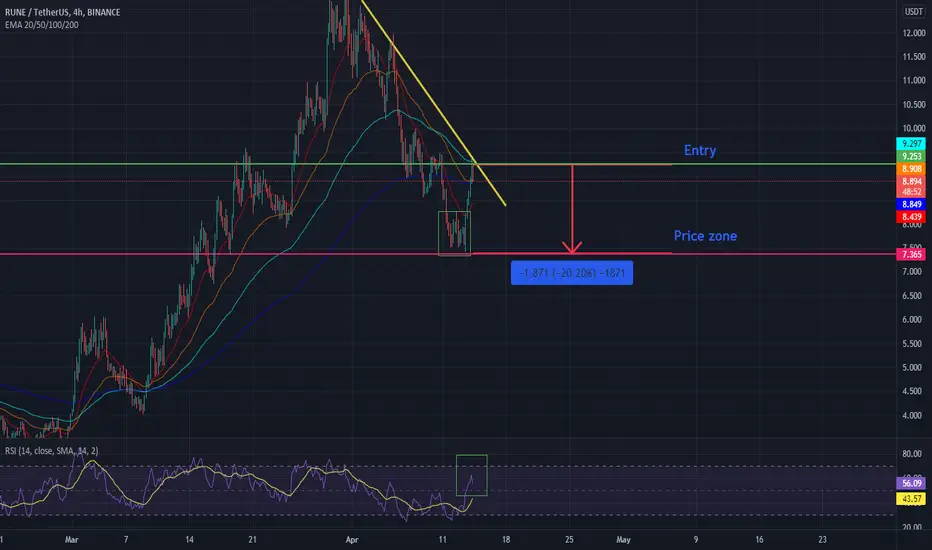
RUNE/USDT double top playing out The RUNE/USDT has showed a double top pattern on the 4H chart and is likely to play out on the longer time frames.
This follows a likely price drop from 9.29 USDT to 7.38 USDT. A drop in 20%.
This also follows a rejection from the EMA lines and the RSI shows signs of being overbought.
Here has the analysis showed sign of playing out on the daily time frame.
No financial advice.
rr=2.85bearish shark pattern + bearish nen star pattern + divergence RSI + break out parralel channel
tp: last pic

RUNEUSDT SHORT Rune is forming a head and shoulders pattern which is a bearish pattern, It might fall to 4 usdt.

rr: 2 sell ideaharmonic bearish pattern
rsi divergence
tp 2 fibo level and resitance
engolfin
never risk more than 2% of capital per trade
