Sandbox idea updateLast post on sandbox highlighted liquidity area. We have now reached the area and price seems to be accumulating. Will we be seeing higher prices for sandbox from here??
SANDUSD trade ideas

The Metaverse and Lawsuits - Which will Survive Long-Term?Facebook's Metaverse projects are already running into snags with lawsuits and regulations -- the companies that have a central point of control (which are many) will be susceptible to these threats, especially as their user-base starts to grow. A closer look at some of the metaverse projects out there in the running right now.
Also a featuring a few open-source "Virtual World" projects that may decide to get into crypto at some point as an evolution on their existing platform. Worth keeping tabs on, either way. (Vircadia, OpenSimulator.)

SANDUSDSANDUSD is a correction period. See that the price has a chance to go up
Waiting to buy the blue zone, target 6.669

SAND - Trend-Following Buy Setup!Hello everyone, if you like the idea, do not forget to support with a like and follow.
SAND is overall bullish and now approaching a strong demand zone in green so we will be looking for buy setups.
on H4: SAND is forming an inverse head and shoulders pattern, but it is still an idea.
Trigger => Waiting for the right shoulder to form then buy after a momentum candle close above the gray neckline.
Meanwhile, until the buy is activated, SAND would be overall bearish can still dive inside the demand zone before going up.
Good luck!
All Strategies Are Good; If Managed Properly!
~Rich


SAND with much support after last bull run#SAND with much support after last bull run, but the run went till the 161.80 LOG FIB extension...
This #crypto might take a breather... support was found and can be find on...
...Supertrend
...RSI
and OBV 😎
Drop me a nice comment if you'd like me to analyze any other cryptocurrency or do another comparison.
*no financial advice
do your own research before investing

SAND is 2021's top performing cryptoSAND is one of the top performing cryptocurrencies for 2021.
Since Facebook announced its rebranding as Meta on October 29, SAND has shot into crypto fame and rallied more than 600% by November 24. It is estimated that if you bought $500 of Sandbox on January 1, it would now be worth over $73,000.
SAND is the native token of The Sandbox, a game that is very similar to Decentraland which recently opened the doors of its Metaverse. Unlike Decentraland, it has not yet fully launched its virtual world to the general public but only to a select group of 5,000 users who have the chance to earn up to 1,000 SAND and three exclusive NFTs. Players can purchase land and create non fungible tokens (NFT) within the game and earn the Sandbox token (SAND) by completing various quests.
The Sandbox has announced a number of famous partnerships which include The Smurfs, Atari, the Walking Dead, Adidas, and Snoop Dogg. It was recently reported that someone paid $450k to be Snoop Dogg's neighbour on The Sandbox Metaverse.
NFT-linked cryptocurrencies were the best performing group of digital assets in November, as the interest in the Metaverse keeps growing. Will Metaverse tokens explode in 2022?
It's a good moment to give meta tokens like SAND some thought.


Sand is doing something GOOD!Hey guys, this is Julie 😄
Let's analyze this sweetheart today. Sand is amazing, right? To go from under $1 to $8, this is really amazing. If you (like me) couldn't take advantage of this super high, maybe this is our chance!
Although Sand has been falling since November 25, the trend is still bullish if you look at the weekly chart. In fact, it is quite normal to fall after such a big high. I believe that Sand is just resting for a while, to continue rising later.
Looking at the daily chart, we can see that today's candle seems to be forming a Bullish Harami pattern, and this is a good buy signal!
It is in the same region as before, which seems to be a support level (pink line). Below this area we have the yellow line, which was the lowest point in December 04, and almost the close on November 22, I think this could also be a resistance.
It is in the same region as the 21 EMA as well, I like to use this for buy confirmation.
Because I believe in its potential, I would really buy Sand, this seems a nice and technical point to buy.
It's such a good crypto, right? Sand has a huge potential, I really like cryptos like this, with good plans for the future.
I know someone who bought sand for less than $0.27, just because he believed in its potential (he is really happy now hahahah).
And he was right, sometimes you should buy even without confirmation, just because you believe in the project.
And that's it. Thanks a lot for reading my analysis! I hope you enjoyed it. 😊
Remember to support me with your like and subscription, I really enjoy writing these analises. 😄😉
Have a good weekend, bye bye!

Sand/USDT (Binance Future)Sand/USDT (Binance Future)
its making Double top pattern, for making sure this strategy,
i usually enter the market if market returns the neckline after bearish market,
then im gonna open my short. and then TP would be somewhere near Fib 0 level.

SANDUSD (1H) Bearish breakoutHi Traders
SANDUSD (1H Timeframe)
The market is in a downtrend and we are waiting for an entry signal to go SHORT below the 5.01 support level. Only the upward break of 5.68 would cancel the bearish scenario.
Trade details
Entry: 5.01
Stop loss: 5.68
Take profit 1: 4.61
Take profit 2: 3.95
Score: 3
Strategy: Bearish breakout

Evergrande Defaults -- What Does This Mean for the #Metaverse?Evergrande defaulting didn't have a negative impact on the metaverse coins like $SAND and $MANA -- but the US real-estate market may be next. What are the likely outcomes?


SANDUSD (4H) Bullish reversalHi Traders
SANDUSD (4H Timeframe)
Waiting for the upward break of 6.21 resistance level which will complete a bullish trend reversal pattern to go LONG. Only the downward break of 4.75 would cancel the bullish scenario.
Trade details
Entry: 6.21
Stop loss: 4.75
Take profit 1: 7.08
Take profit 2: 8.50
Score: 6
Strategy: Bullish reversal

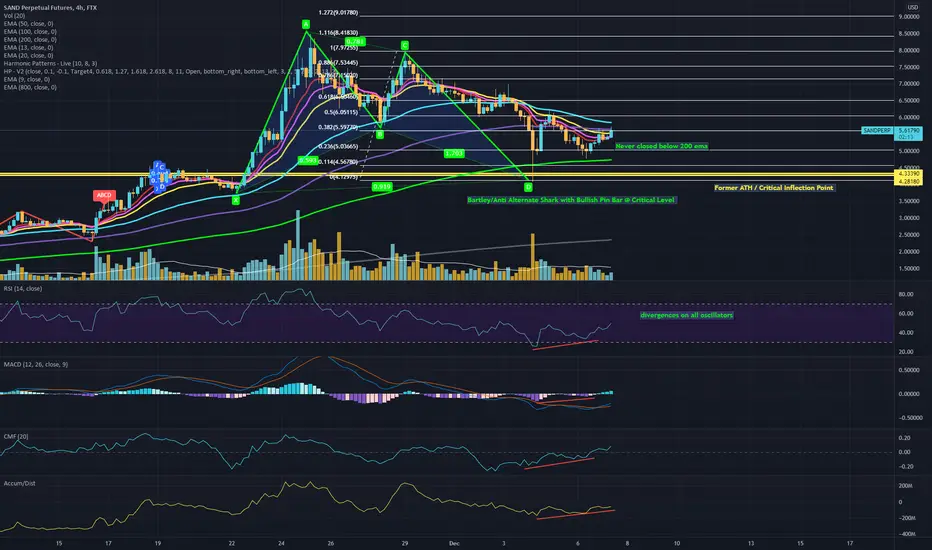
SAND anti alternate shark SAND the gift that keeps on giving
the coins you want to be in right now are ones that held above their critical inflection points, are above previous aths, showing divergences, etc. sand not only meets that criteria but also appears to be one of the strongest in that category
SAND Short 200 DEMA denial I am calling a short term short on SAND based on the recent 200 DEMA denial coming on strong volume on my one hour chart. As pointed out in my chart this is the second strong denial of the 200 DEMA in the last handful of days.
SAND just does not simply look ready for a breakout, I believe it will continue to trade in this current channel until the fear/greed index starts moving out of "extreme fear" and towards neutral/greedy.

SAND hammer candle with long shadowCould possibly be a trend reversal, in the last hour its been a good hour for 3x long but I am waiting for volume to take any more positions and putting stop loss on the 3xl

SANDUSD Potential - Bullish Pennant Breakout - SANDUSD Potential Bullish Pennant Breakout from a few days from now imo.
Drawn on 12/3 @ 2:13 am
What do you guys think?
Thanks in advance!

SAND downward wedge #2 + MACD over zeroMACD has now crossed over zero on @HPotter MACD indicator. This is a bullish indication and the explanation I have quoted from the writer of script himself:
"Moving Average Convergence Divergence. The MACD is calculated
by subtracting a 26-day moving average of a security's price from a
12-day moving average of its price. The result is an indicator that
oscillates above and below zero. When the MACD is above zero, it means
the 12-day moving average is higher than the 26-day moving average.
This is bullish as it shows that current expectations (i.e., the 12-day
moving average) are more bullish than previous expectations (i.e., the
26-day average). This implies a bullish , or upward, shift in the supply/demand
lines. When the MACD falls below zero, it means that the 12-day moving average
is less than the 26-day moving average, implying a bearish shift in the
supply/demand lines.
A 9-day moving average of the MACD (not of the security's price) is usually
plotted on top of the MACD indicator. This line is referred to as the "signal"
line. The signal line anticipates the convergence of the two moving averages
(i.e., the movement of the MACD toward the zero line).
Let's consider the rational behind this technique. The MACD is the difference
between two moving averages of price. When the shorter-term moving average rises
above the longer-term moving average (i.e., the MACD rises above zero), it means
that investor expectations are becoming more bullish (i.e., there has been an
upward shift in the supply/demand lines). By plotting a 9-day moving average of
the MACD , we can see the changing of expectations (i.e., the shifting of the
supply/demand lines) as they occur."
Source:
credit: @HPotter

SAND short term short playlooking for bearish confirmation on what appears to be evening doji star candle pattern (1hr) and strong sell volume. might open 3xs short etf on mexc.

$SAND- BULLISH PENNANT ON HTFsSeems like Sand wants to get done with this pull back thingy ASAP!
Dude seem unfazed by $BTC smh!
