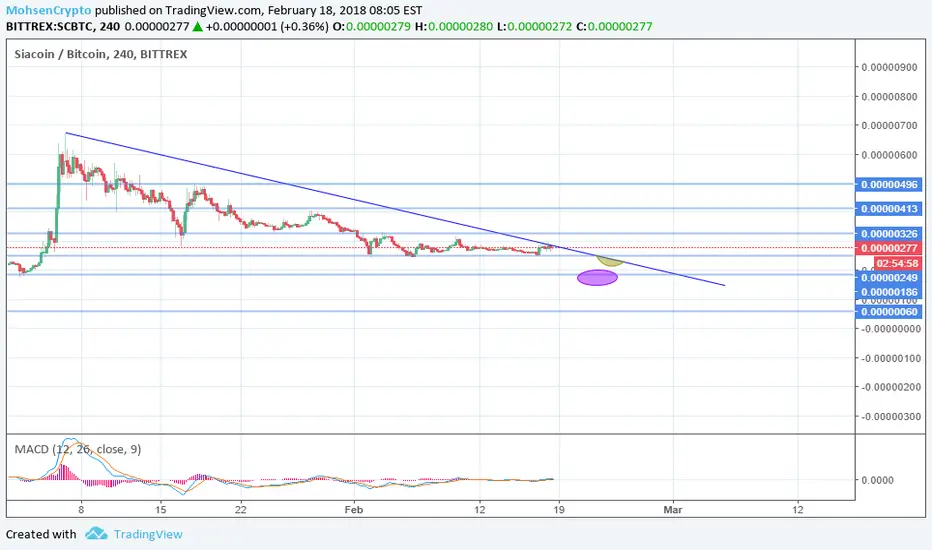
SIA COIN CRITICAL POINTS ! Traders,
Here we have SC/BTC 4H chart.
We have support level that can make double bottom scenario so that's what i'm expecting next few day
1-Touching price 186.
2- Reflect to 250 and breakout from there.
Regards,
Mohsen
SCBTC trade ideas

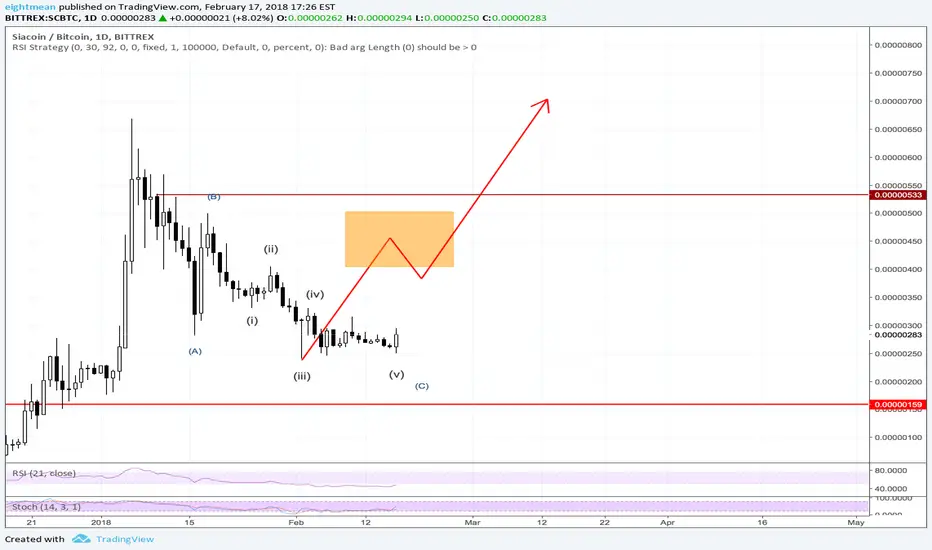
Siacoin SC SCBTC Sia400-500 need to be reached in order to consider longterm rises in price /400-500 sat range/
Looking more into details, I still miss one more low- fifth wave /lower than one on 2nd of feb/. Sometimes markets are loosing this wave in a correction thus remaning aside this market.
SC - SIACOIN BUY AT THIS PRICESC will move to the uptrend channel in a short time. After 310 , SC will jump to 400 easily
Possible Double Bottom ?Hey Yall
Its not as clear on the 1 day chart, but on the 4 hr & 1 hr chart it seems that a possible double bottom is forming on the 50% retracement line. Seems we have strong bullish presence at the moment but will be keeping an eye on the situation to see how it plays out.
COINBASE:BTCUSD is on a strong bull run at the moment, but we will see if BITTREX:SCBTC can keep the bull run going before the BTC corrective candle.

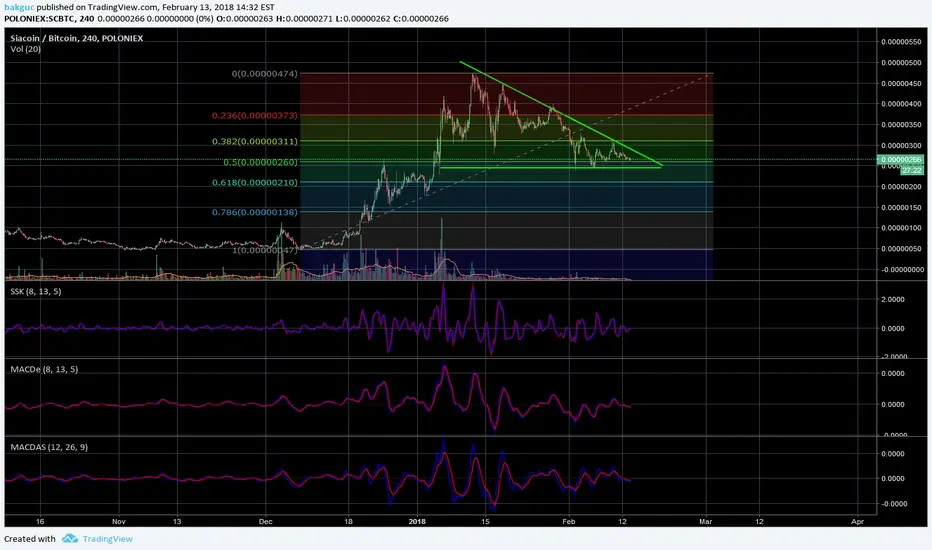
Siacoin SC/BTC - Ready to make a move (100% potential)Sia seems to have made a breakeout in a similar way to XVG. EMA's are converging and we should see EMA 9 crossing EMA50 soon. Target is close to 590 sats. I would wait for SC to cross above 315 sats in the next few days to get a confirmation of the trend reversal.
Sia at 286 sats is sitting exactly on the 0.618 retracement ratio, it makes sense to see a new leg up from this point.

SIACOIN ANALYSIS FEBRUARY 10 , 2018The price moves in a descending channel from the closing price of 0.00000564 BTC to 0.00000290 BTC and the price starts to move on the ascending trend line. On a regular basis, expect to respect the bullish trend line to reach the following prices
0.00000320 BTC
to me
0.00000567 BTC
If the bullish trend line breaks, prices will face a strong support area that has been tested several times before
Between 0.00000176 BTC and 0.00000244 BTC and we expect the price rebound from then again.

New run for Siacoin (SC)? The red line could be the longterm down trend line.
Buy volume is increasing.
RSI confirms trend reversal.
At the moment we trying to break out.
A new BTC move up as catalysator could bring Siacoin back on track.


Siacoin (Cup & Handle Formation) - Easy 500% Profit (Long term) Hello Guys.
First of all, SiaCoin is very good project related to secure cloud storage at low cost. Which might be big in future. I am very much Bullish on Siacoin.
As per the chart, We had a nice Cup and Handle formation and reached the support and holding there pretty Hard. It is a good sign.
Buying Zone: 0.00000250 - 0.00000330
Target 1 : 0.00000400
Target 2 : 0.00000575
Target 3 : 0.00000800
Target 4 : 0.00001385
Stop Loss: 0.00000225
Note: Don't forget to put the stop loss.


What is SIA up to?I have no clue about the fib, just trying some new things, feel free to leave feedback


Sia reversalAfter a very solid correction and now consolidation, SC is ready for another takeoff.
Last time it consolidated like this there was very bearish alt sentiment which primed us for a bearish breakout. However, this time we finally have flipped over to bullish sentiment and we've seen what sort of catalyst that can be, just look at my BTC TA from yesterday.

#SIACOIN#SC Can Buy Now At 0.00000260/0.00000277 And Buy Again At the Sopport Areas 0.00000240/0.00000250
Target -- Short * 0.00000301/0.00000339 -- Medium *0.00000360/0.00000400 -- Long *0.00000500/+0.00000600*
dont forget the Stop Loss 0.00000229

$SC Descending Triangle $SC Descending Triangle with Lower Highs and Strong Support, Strong FAs coming in March, we might see a strong Uptrend once it breaks out of the triangle. #Noob #Learning #TA #Crypto


Sc just need volume Need volume,
Stoch and Rsi crossing, macd too
actually at awesome point but noo volume for alts yet except big boys

Siacoin (SC) on the verge of breaking outThis coin is very much like XDN. The graph, the indicators all look almost identical. It is actually a bit weird. After a period of consolidation since more than a month, I think it is ready to move. The StochRSI on the 1D chart has become really bullish, and there is a lot of room till it gets oversold. Looking at the MACD and it's histogram, it looks like sell off is over and the lines are about to crossover. The indicators on the short term charts: 1h 2h and 4h are all looking very bullish too.
Don't forget to diversify and set your stop losses.
Cheers and good luck!
Tips:
BTC - 1FPLEZw1WXK4ojqap3R1KtXxubDsrLps7g
ETH - 0x080cC01b0abA63Bde5cC535d92F0fEd8722b1678


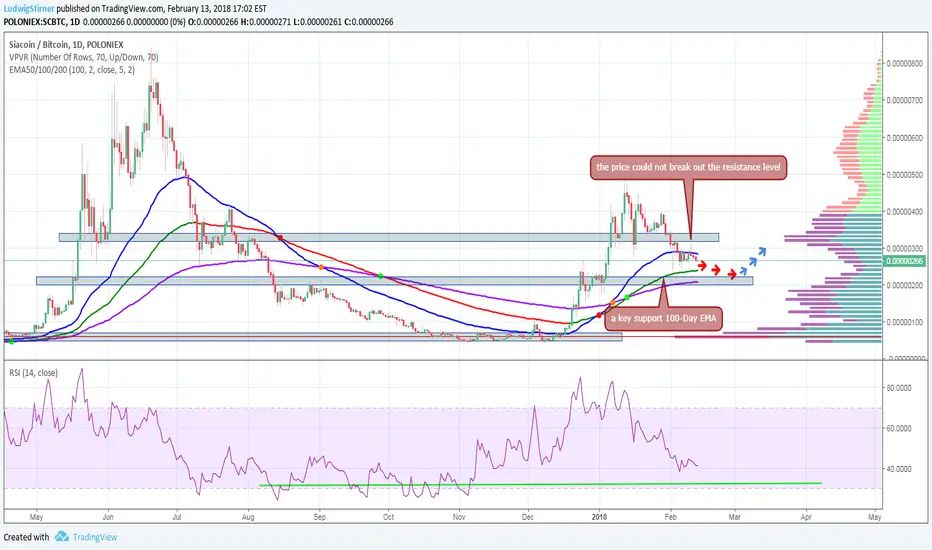
Sia May Be Headed LowerSiaCoin has corrected rather sharply since mid-January, followed by a brief downtrend this month. However, the coin seems to be headed lower again. After facing resistance from the 50-Day EMA, Sia price has moved lower over the last few days and the next level of support for the stock will come from the 100-Day EMA at just over 220 Sats.
With no specific bullish triggers in sight, there's a good chance the coin could slip to this level. Further, Sia's MACD doesn't look poised to make a bullish crossover with the signal line right now, which is another bearish signal. SiaCoin is far from oversold territory, which allows room for further downside. However, if you look at the volume profile, it confirms the support and resistance level that SC will hold for a few next weeks.