SGDAUD trade ideas

AUDSGD is near Mirror LevelWe can see support zone here.
The price can bounce from Mirror Level 0.93947 again.

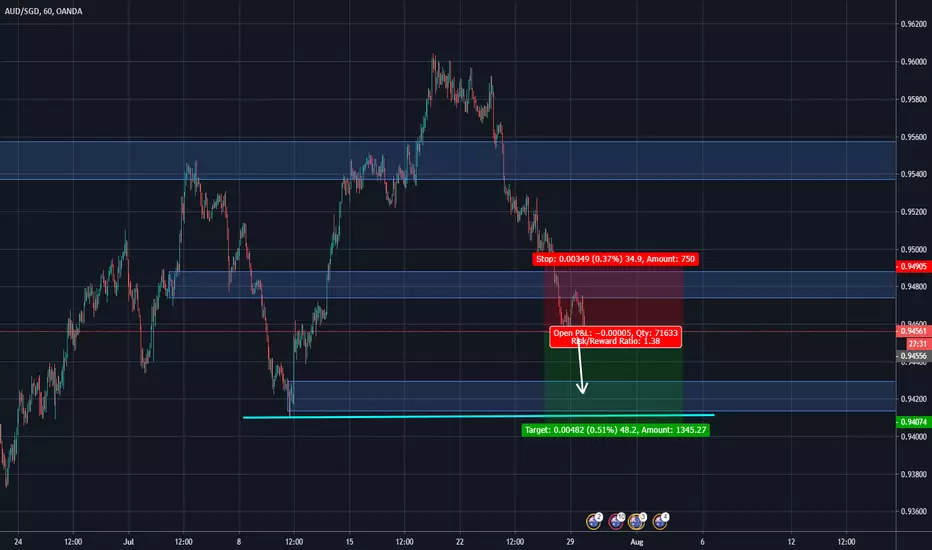
AUD/SGD short sellAUD/SGD short sell position.
follow Money management rules.
Entry - CMP
SL - 0.94258
TP - 0.93553


AUDSGD above Mirror LevelAUDSGD crossed the Mirror Level 0.93939.
We can open short term BUY if the price will pullback to Zone.


AUDSGDTP hit and price still dropping watching the low area we may see a long term sell off down to that area
But we will wait and see how price moves

AUDSGDRan as expected but just short for the TP mark - s3.tradingview.com
Lows were not broken we might have lower price after this pullback so lets wait and see

Trading the Trendi base my trade using pivot and trend.
this is not a trade signal but a personal chart and journal.
but feel free to follow and comment.

AUD/SGD (LONG - BUY)AUD/SGD (LONG - BUY)
On the weekly chart the AUD/SGD have just completed a Minor (weeks) Elliot wave cycle. The daily chart have just completed wave 4 on a Minute (days) Elliot wave cycle and a trend reversal on the daily and 4 hourly is therefore expected towards an expected uptrend.
Elliott Wave Theory Categories:
Grand Supercycle (multi-century)
Supercycle (about 40–70 years)
Cycle (one year to several years)
Primary (a few months to a couple of years)
Intermediate (weeks to months)
Minor (weeks)
Minute (days)
Minuette (hours)
Sub-Minuette (minutes)
A Descending Triangle has formed on the monthly chart which indicated a trend reversal and therefore a possible beginning of a new uptrend if the monthly support line remains strong. In descending triangle chart patterns, there is a string of lower highs which forms the upper line. The lower line is a support level in which the price cannot seem to break.
The monthly trend is Bearish
The weekly trend is Bearish
The Daily trend is Bullish
The H4 trend is Bullish
Institutional Order Flow Areas (aka Supply & Demand):
Institutional Order Flow Areas (Demand) has been resisted once on the hourly chart
Currency Strength Indication:
Weekly: The SGD is slightly stronger than the AUD
Fundamental Consideration for the week:
AUD High: 3
AUD Medium: 1
SGD High: 0
SGD Medium: 0
Entry:
Entry at: 0.94568
Take Profit:
TP1: 0.95089 (move SL to TP1 once reached)
TP2: 0.95318
TP3: 0.95921
Stop Loss:
Stop Loss at around 0.94092
Good Luck – Trade Responsible.
Use 1% risk per Position!
Always strive to continuously improve your trading strategy and knowledge

LONG (1Day) - Inverted Head and shoulderWe can see AUDSGD back test the neck line. Long here with a little loss and big frofit.
Cutloss if falling over Marobuzo candle.
Target 0.973


AUDSGD Sell SignalPattern: Neutral trading between support and resistance levels.
Signal: Bearish after the formation of a Double Top.
Target: 0.94400.

(First Analysis Post) Head and shoulders breakout current head and shoulders pattern on daily near resistance , possible breakout at the bottom of my key zone (0.95857) and above this zone has been tagged as the lowest from monthly , weekly and daily. Neckline has previously been support.(A BREAKOUT IS MOST LIKELY TO OCCUR).
(MY OWN THOUGHTS!!!!!!!)
(Open to criticism and feedback to help improve my analysis)
thanks


38.2% & POSSIBLE 61.8% Retracement LONG GWAVE38.2% & POSSIBLE 61.8% Retracement LONG GWAVE.
FIB Retracement Percentage is calculated in a Higher Cartesian and or Euclidean Dimension.
PLEASE ALWAYS WAIT FOR STOCHASTIC CONFIRMATION!!! THANKS

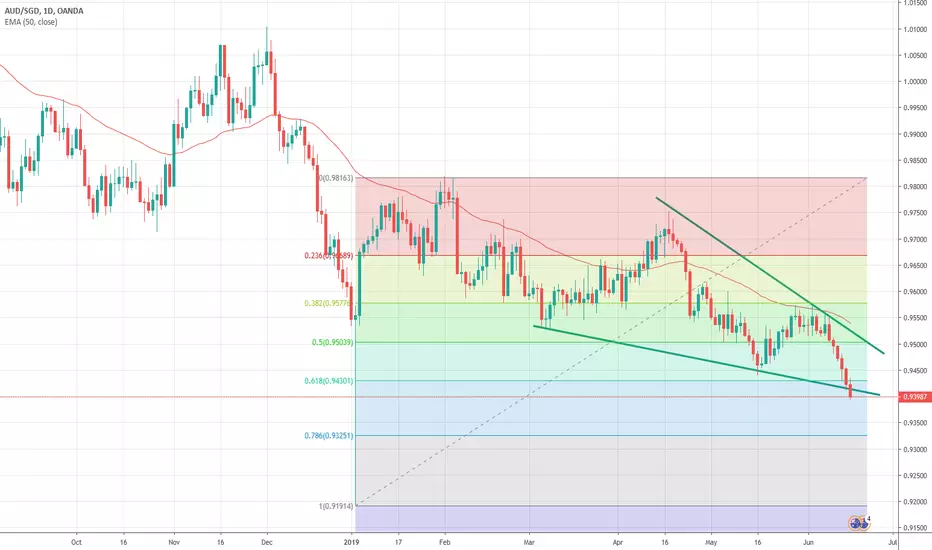
Aussie - Sing Dollar continues to channel lowerThe Australian dollar continues to fall against the Singapore dollar as we have developed a reasonably reliable downtrend channel. This makes a lot of sense, because the Singapore dollar is quite often used as a bit of a safety currency in Asia, while the Australian dollar is so highly levered to the Chinese mainland.
At this point, you can see that the 50 day EMA is just above recent trading, and we are testing the 61.8% Fibonacci retracement level. Ultimately, we are at roughly the middle of the down trending channel, so therefore it looks as if the channel will continue to hold going forward. With that in mind it’s very likely that we are probably going to reach towards the 0.9350 level, before bouncing again to find even more sellers.
It’s very likely that this pair will continue to drift lower until we get some type of resolution or at least serious progress to the US/China trade relations, or perhaps even signs of global growth. At this point it doesn’t seem like we are getting that anytime soon, at least not anything that you can hang your hat on. Because of this, we can simply extrapolate that every time this market rallies, you should be looking for signs of exhaustion to start selling.
The 0.95 level which coincides perfectly with the 50 day EMA will more than likely continue to offer resistance, just as a break down below the lows from last week opens the door to the previously mentioned 0.9350 level. All things being equal though, you should remember that this pair doesn’t necessarily move quickly, but rather steadily. That makes it a great longer-term trade as you can see. It is not until we break above the 0.9550 level that I would be concerned about the downtrend, and even then we would need to see a significant close above that level on the daily chart. As things stand, downward channel trading continues to work.

[AUDSGD] [FOREX] A setup for short?It is not really obviously that which side is in charge of the market for the last few weeks. However, when we take the closer look at D1, it seems like the Seller has take back control with a big down bar. Now our job is waiting for the pullback around 0.951 for the entry with SL above the nearest high on the D1 which is 0.955

Aussie sinks against the Singapore dollar againThe Australian dollar initially tried to rally on Monday but continues to sink against the Singapore dollar. This is essentially a “risk off” trade, as the Singapore dollar is basically the “Swiss franc of Asia.” With that being the case, this shows that risk appetite is struggling, at least when it comes to all things Asian. That’s not a huge surprise, considering that the US/China trade war is starting to put up horrific economic figures in mainland China itself.
Now that we have broken through what could have been the bottom of a falling wedge, we now find ourselves below the 0.94 handle. That is a bearish sign, especially considering that the 61.8% Fibonacci retracement level is just above current trading as well. Now that we have broken through it, it’s very likely that we could wipe out the entirety of the move, or at least make a significant turn towards more bearishness.
At this point, it’s obvious that rallies will continue to be selling opportunities, as the 0.95 level should be thought of as a significant barrier, one that probably will be broken anytime soon. If we were to break above the 0.95 level, at that point the trend would change. However, at this point it looks very unlikely that rallies will offer anything but selling opportunities. The Australian dollar will continue to suffer as long as the US/China trade wars continue, and therefore this downward trend should continue. Money flows away from commodities and into fixed income and stability of banking services such as we see in Singapore. This trade continues to work, and therefore signs of exhaustion continue to be opportunities for entries into what has been extraordinarily reliable trend. At this point, there’s no sign of a rebound but if we see the US and China come to terms, this pair will shoot straight back up in the air.
AUDSGD - Aussie is going to tank to 70c SGDThe big trade everyone is talking about at the moment is the AUDCAD but I think this could be a nice little winner. I love finding odd inflection points which to hang my trend lines off because when they’re right you can predict things out by years.
So using the same method to draw a trend line that my poorly drawn red circles give me, the pink ones paint a gruesome picture. If the current green trend line holds and the price cant keep above it expect the AUD to collapse against the SGD. The failure of the 20 to cross the 50 backs this up, plus to woeful state of the Aussie economy backs this up on the macro side.
If you couldn’t guess the yellow circle is my target.
