aapl 2 scenariosaapl 2 scenarios .. 1] buy after the break above the resistance level .... . 2] sell after the break under the support level
AAPL.USD trade ideas

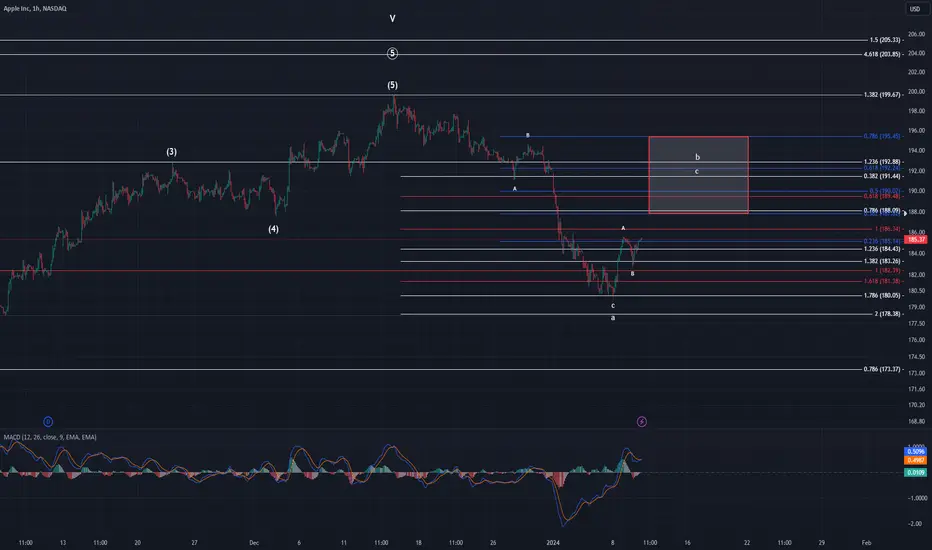
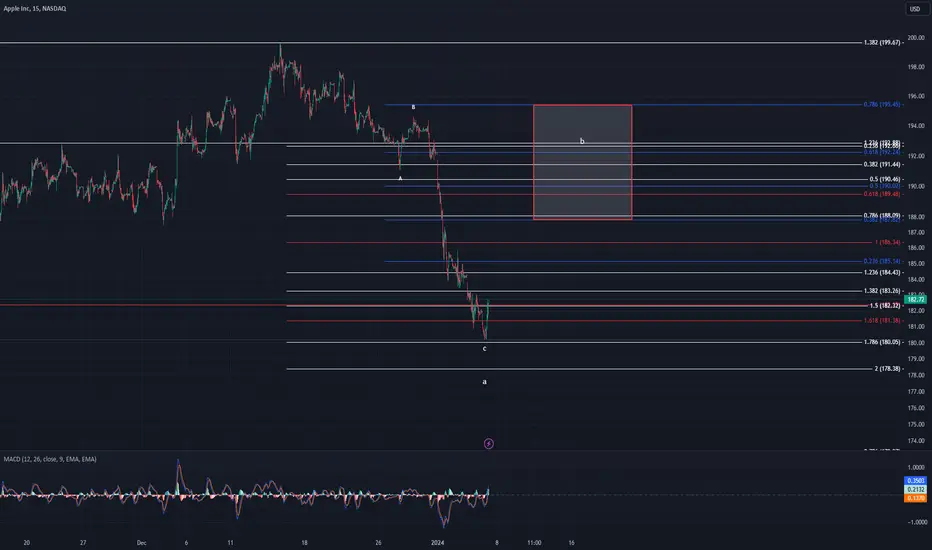
AAPL UpdateJust wanted to update everyone on the moves AAPL has been making lately. It is still following my path drawn out for it. If it is to remain standard, then I want to see it tag my target box drawn. As you can see on the chart, there is a decent amount of fib confluence around the $192 area which is where I think this move is likely to end.
Once we begin to drop for wave c, I expect that to take us to the $160's-$170's. Until we have a full b wave carved out though I can't be for certain. The higher b goes the higher c will end. That c will just be the last sub-division in a larger A wave. As with other corrective structures this thing is going to be sub-dividing for a while. If this is in fact the beginning of Super Cycle wave (II) as I am calling for....get used to the choppiness. This is the type of structure/price action you will have to trade for the next couple decades IMHO. As my mentor has said before, "This isn't your dad's or even your gpa's market". This is most like your great great gpa's market and most alive today have never even seen it let alone traded it before.
I want to see us breach the 0.382 @ $187.82 at the least before dropping again. Once we finish this b wave, I will draw more refined targets for the next wave. Good luck y'all.
I will be out of town for the next two days on a mini vaca for my sons b-day. I'll still have access to the charts via my phone, but it isn't the same as a computer. Due to this I won't be making new posts tomorrow night but will post again Thursday night.
Also, I want to remind everyone, starting March 1st, my posting schedule will be dramatically altered.
AAPLAAPL was still bullish hold it in till tomorrow. looks like a bull flag on 30 30-minute Macde just close to positive side

AAPL: Support at 160-180, Target 220-240AAPL stock may find support between 160 and 180 and could potentially reach the 220 to 240 range by the second half of 2024.

Apple is under pressure. Trading idea for 09/01/2024The US Department of Justice is preparing to initiate a large-scale antitrust case against Apple Inc. This action is prompted by the dominant position of Apple devices in the market and the measures the company has taken to safeguard its business.
As reported by CNBC (www.cnbc.com), investment specialists at Piper Sandler have revised their forecast for the price of Apple Inc. shares, lowering it from 220 USD to 205 USD. The issuer faces fines and the necessity to restructure its business.
In the long term, this situation might lead to a decline in revenue. However, if Apple wins its case, it could give a powerful boost to its shares.
So, today, we will look at the Apple Inc (NASDAQ: AAPL) stock chart.
On the D1 timeframe, there is a noticeable downward trend. Resistance has formed at 194.66, with support at 180.18.
On the H1 timeframe, if there is a rebound from the 173.60 level, the short-term target for a price increase can be set at 189.06, while in the medium term, it could hover around 205.00.
—
Ideas and other content presented on this page should not be considered as guidance for trading or an investment advice. RoboMarkets bears no responsibility for trading results based on trading opinions described in these analytical reviews.
The material presented and the information contained herein is for information purposes only and in no way should be considered as the provision of investment advice for the purposes of Investment Firms Law L. 87(I)/2017 of the Republic of Cyprus or any other form of personal advice or recommendation, which relates to certain types of transactions with certain types of financial instruments.
Risk Warning: CFDs are complex instruments and come with a high risk of losing money rapidly due to leverage. 66.02% of retail investor accounts lose money when trading CFDs with this provider. You should consider whether you understand how CFDs work and whether you can afford to take the high risk of losing your money.

All Eyes On Apple as it Tests 2021 HighsAll Eyes On Apple as it Tests 2021 Highs
Today Apple NASDAQ:AAPL is testing the following:
1. Dec 2021 Highs
(no sustained increase in value since then)
2. The 200 day moving average
3. The Diagonal Support Line
This means that in 24 months Apple has not made any significant or sustained gains. Apple needs to bounce here or it will lose three very important levels of support.
You can clearly see that we may have a short term double top too.
If we lose support here look to the 200 week moving average....
Lets see what happens
PUKA

AAPL AnalysisPrice played out nicely as analyzed last week, giving us a -6.42% move to the downside. From here, I'm expecting price to make a bullish move, to the upside, potentially to fill the FVG at 190.08 next, given that price is currently in the discount array and there are signs of bullishness coming into the market.

Apple on a 3 drives patternNASDAQ:AAPL on a possible 3 drives pattern with take profit at the 618 and the full retrace back to new all time highs.

200 target from B Wave. 2nd trade of 2024For my 2nd trade of 2024. Long Apple to $200 and will reevaluate. Stealth hidden abcd pattern also inside elliot wave. Btfd

AAPL
AAPL is exhibiting a strong bullish trend. I purchased 15 call contracts last Friday. After observing a double bottom last Friday, I decided to sell 10 contracts, take profits, and retain 5 contracts for the potential upward movement throughout the week. My next target is set at $185.33 and $185.88.

Buy Apple at bottom - intraday may see a strong bounceNASDAQ:AAPL may see a strong bounce today after a strong upside. Selling is kinda exhausted in the intraday basis

appleCrash is coming, as example Apple to 100$ this year, most likely 2 quarter. Stock market -30%. 100% not the best time to buy stock. In the next 5 months it will be more clear situation. Seems boldly but we will check it soon

AppleThe Apple stock forecast is a not-so-impressive $180.57, which would sadly result in a -0.34% loss.
Ouch! But hey, don't lose hope just yet. In the upcoming week, it's expected that the price of AAPL will take a dip of -2.28% and settle at $177.04. It's a bumpy ride, my friend, but that's the stock market for you!

APPL BUY+++++ bonce back to $192AAPL is way oversold here on several time frame indicators and due gfor a bounce back to $192 in coming days

AAPL Weekly Harmonic Elliott Wave and Hurst's Cyclic AnalysisReview:
Let's review the highlights of the previous update (December 23rd 2023):
In wave (C) of Y of a of b.
On Tuesday, we will have the first 20D cycle trough of the second 40D cycle of the first 80D cycle of the 20W cycle.
Update:
Analysis of the Structure:
The down move was a lot more aggressive than I expected. We knew that we are in wave b of 5, and mentioned before that I expect it to be a triangle, but it can turn into any other kind of correction with the same probability, which is the actual case.
I see wave b of 5 of (A) completed as a triple zigzag now. What we expect next is the last leg to the upside before a multi-month correction starts (wave (B)).
Analysis of the Cycles:
I think we got the 80D trough on Friday, which was a 70-day cycle and very close to the nominal value of 68.
We are now in the second 80D cycle of the current 20W cycle.
Troughs to come:
1. 20D trough on 22nd or 23rd January.
2. 40D trough 7-9th February.
3. 20W trough in the last 2 weeks of March.
There are some major warning/bearish signs on the cyclic analysis of AAPL that might lead to an invalidation of our count and change to the cyclic analysis in the coming weeks:
1. The 80D FLD was expected to provide support for the price action and lead to a bounce, but we got crossed below this FLD and even surpassed its downside target (183).
2. We got a close below the 18M FLD this week.

Apple at a potential support levelI would like to see NASDAQ:AAPL bounce at this potential support level. It closed this week below a key MA, which is a bit worrying.

AAPL TA 1-5-24 + MACRO OUTLOOK on STONKSAn outlook on Apple for the short term and long term outlook. As well as Macro Outlook on Stock. How will January play out. Will that give us a good read on the rest of 2024. How should we navigate the 1st and 2nd half of the year

Bullish Divergence + Potential Wedge breakout early next weekIt's pretty self explanatory.
RSI and price have diverged.
Looks primed for a breakout of the wedge. Probably going up to fill the gap before going back down again.
Short term long, longer term short imo

AAPLObserving the chart pattern, it appears that a potential head and shoulders formation is likely to occur next week. I am anticipating a bullish trend for AAPL.

AAPL Update: Top Appears inYesterday, I called for us to drop to the 1.618 area and bounce higher for our b wave retrace. We dropped slightly under that just shy of the 1.786 fib. Price has since started to move up and looks headed for my next target box for b. After it carves out this retracement, I can then dial in targets for our c wave. Nothing is confirmed yet but looks to be following my forecast. If price behaves and ends in my target box , I may buy a couple puts for the fall. Time will tell.
Some of my posts contained some contraband yesterday and were removed. The text has been removed and I am just re-posting this bottom portion so y'all can still see the other information.
I was originally expecting another higher in Apple due to the fib levels we were at. The last two days seem to say otherwise, though. We have breached the 0.5 retracement fib this morning which is normally a red flag this wasn't wave (4). Breaching the prior wave 4 is the first sign we had showing the upside was cracking. Waking up this morning and seeing we tagged the prior wave 1 high with the MACD reading we have all but confirmed this. The confirmation will be a breach of $165.27 to the downside. If this is the correct count, and we have topped, then we are seeing the very first mechanisms of the Super Cycle wave (II) starting. That means we're beginning the consolidation of gains from 1982 up to last month. This will take years-decades to complete.
Looking at the structure alone we have an abc completed. Add fibs into the picture and I would like to see us get OML into the 1.618 fib @ $181.38 before a small retracement for wave b, but this is not required. The micro b I am expecting would "normally" go to the high $180's before the next c wave kicks in and sends us lower. One thing to always remember about corrective action is it is choppy and overlapping. This is obvious in the a-b waves at the beginning of this move down. It then made a 5-wave drop for it's c wave.
Once it starts its next retrace for wave b I will be able to dial in some retracement fibs to help narrow the target area. Wave b will normally be marked by overlapping/choppy price action. This is what I will be looking for today. Once the b wave completes, I expect the drop that follows to be strong much like this mini C wave. I can't be for certain without a completed b wave, but micro-wave c will most likely bottom in the $160 area. I am NOT saying this is the bottom before another rally. I am saying that would complete the first larger A wave within this cycle. Let's not get to ahead of ourselves though and take this one step at a time.
M top pattern on AAPLChart speaks for itself, however judging how a recession is now the base case an M top pattern on a large S&P500 stock may be the hint we need. Wait for break of neckline (Red line).

Apple Could Be OversoldNegativity has mounted in Apple since the year began, but some traders may think it will bottom soon.
The first pattern on today’s chart is the price area between $180 and $184. That roughly corresponds to the peak in early 2022 and some highs last September and October. Will the old resistance become new support?
Second, the 200-day simple moving average (SMA) is rising from below. AAPL bounced at this SMA in March and October.
Third, Wilder’s Relative Strength Index (RSI) just dipped to an oversold condition. Similar readings occurred at or near bottoms in August, October and December 2022.
TradeStation has, for decades, advanced the trading industry, providing access to stocks, options, futures and cryptocurrencies. See our Overview for more.
Important Information
Past performance, whether actual or indicated by historical tests of strategies, is no guarantee of future performance or success. There is a possibility that you may sustain a loss equal to or greater than your entire investment regardless of which asset class you trade (equities, options, futures or cryptocurrencies); therefore, you should not invest or risk money that you cannot afford to lose. Online trading is not suitable for all investors. View the document titled Characteristics and Risks of Standardized Options at www.TradeStation.com . Before trading any asset class, customers must read the relevant risk disclosure statements on www.TradeStation.com . System access and trade placement and execution may be delayed or fail due to market volatility and volume, quote delays, system and software errors, Internet traffic, outages and other factors.
Securities and futures trading is offered to self-directed customers by TradeStation Securities, Inc., a broker-dealer registered with the Securities and Exchange Commission (“SEC”) and a futures commission merchant licensed with the Commodity Futures Trading Commission (“CFTC”). TradeStation Securities is a member of the Financial Industry Regulatory Authority, the National Futures Association (“NFA”), and a number of exchanges. TradeStation Crypto, Inc. offers to self-directed investors and traders cryptocurrency brokerage services under federal and state money services business/money-transmitter and similar registrations and licenses.
TradeStation Securities, Inc., TradeStation Crypto, Inc., and TradeStation Technologies, Inc. are each wholly owned subsidiaries of TradeStation Group, Inc., all operating, and providing products and services, under the TradeStation brand and trademark. TradeStation Crypto, Inc. offers to self-directed investors and traders cryptocurrency brokerage services. It is neither licensed with the SEC or the CFTC nor is it a member of NFA. When applying for, or purchasing, accounts, subscriptions, products and services, it is important that you know which company you will be dealing with. Visit www.TradeStation.com for further important information explaining what this means.

APPLE We are going to leave an order prepared waiting for this bearish GAP to be filled, which makes little sense.
