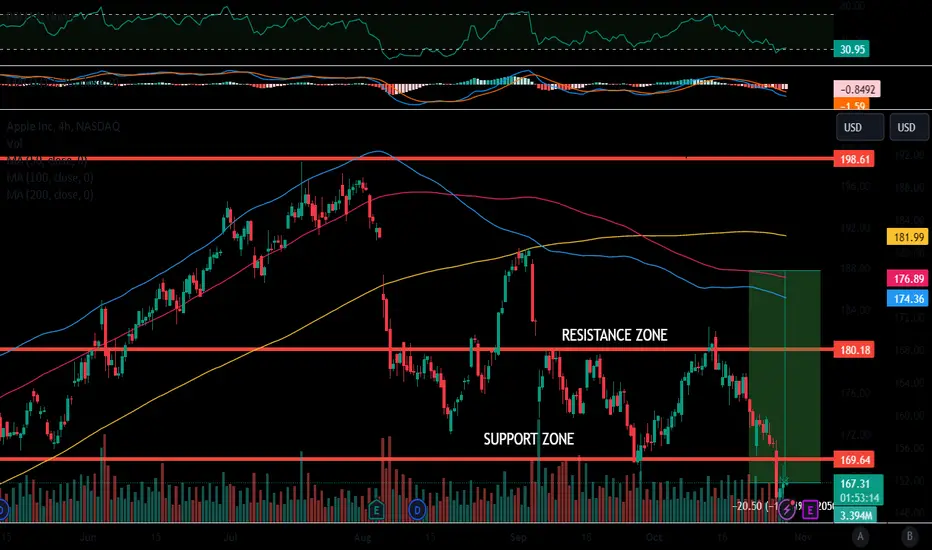
AAPL looking for Short Hey, I think AAPL will continues his drop to our TP Zone. make sure to set your own SL.
AAPL.USD trade ideas

Long-Term Investing in AppleWarren Buffett famously said, 'Volatility is far from synonymous with risk.' So it might be obvious that you need to consider debt, when you think about how risky any given stock is, because too much debt can sink a company. We can see that Apple Inc. (NASDAQ:AAPL) does use debt in its business. But should shareholders be worried about its use of debt?
Why Does Debt Bring Risk?
Generally speaking, debt only becomes a real problem when a company can't easily pay it off, either by raising capital or with its own cash flow. If things get really bad, the lenders can take control of the business. However, a more usual (but still expensive) situation is where a company must dilute shareholders at a cheap share price simply to get debt under control. By replacing dilution, though, debt can be an extremely good tool for businesses that need capital to invest in growth at high rates of return. When we examine debt levels, we first consider both cash and debt levels, together.
The good news is that Apple's demonstrated ability to cover its interest expense with its EBIT delights us like a fluffy puppy does a toddler. But, on a more sombre note, we are a little concerned by its EBIT growth rate. Zooming out, Apple seems to use debt quite reasonably; and that gets the nod from us. While debt does bring risk, when used wisely it can also bring a higher return on equity. When analysing debt levels, the balance sheet is the obvious place to start.
Price Momentum
AAPL is trading in the middle of its 52-week range and below its 200-day simple moving average.
What does this mean?
Investors are still evaluating the share price, but the stock still appears to have some downward momentum. This is a negative sign for the stock's future value.
APPLE Hit the MA50 (1w). Will it hold?Apple hit the MA50 (1w), the strongest long term Support, for the first time in more than 7 months.
The pattern is a Falling Wedge and last time such formation tested the MA50 (1w) from above was on March 14th 2022, and the level held and rose over the 0.786 Fibonacci.
Trading Plan:
1. Buy on the current market price.
Targets:
1. 191.00 (Fibonacci 0.786 like the 2022 fractal).
Tips:
1. The RSI (1w) is also on the same level as March 2022. An additional bullish signal.
Please like, follow and comment!!
Notes:
Past trading plan:

Appleshort after break resistance
1 target - 150
2 target depend on economic situation, it could be 100, but more possible next year

AAPL broke down Bollinger BandAAPL is breaking down the lower Bollinger Band. It looks like this hugging of lower band will continue until the price forms a range at least at lower timeframe to halt the momentum.

APPLE Stock Chart Fibonacci Analysis 102623 Trading Idea
1) Find a FIBO slingshot
2) Check FIBO 61.80% level
3) Entry Point > 165/61.80%
Chart time frame : B
A) 15 min(1W-3M)
B) 1 hr(3M-6M)
C) 4 hr(6M-1year)
D) 1 day(1-3years)
Stock progress : C
A) Keep rising over 61.80% resistance
B) 61.80% resistance
C) Hit the bottom
D) Hit the top
Stocks rise as they rise from support and fall from resistance. Our goal is to find a low support point and enter. It can be referred to as buying at the pullback point. The pullback point can be found with a Fibonacci extension of 61.80%. This is a step to find entry level. 1) Find a triangle (Fibonacci Speed Fan Line) that connects the high (resistance) and low (support) points of the stock in progress, where it is continuously expressed as a Slingshot, 2) and create a Fibonacci extension level for the first rising wave from the start point of slingshot pattern.
When the current price goes over 61.80% level , that can be a good entry point, especially if the SMA 100 and 200 curves are gathered together at 61.80%, it is a very good entry point.
As a great help, tradingview provide these Fibonacci speed fan lines and extension levels with ease. So if you use the Fibonacci fan line, the extension level, and the SMA 100/200 curve well, you can find an entry point for the stock market. At least you have to enter at this low point to avoid trading failure, and if you are skilled at entering this low point, with fibonacci6180 technique, your reading skill to chart will be greatly improved.
If you want to do day trading, please set the time frame to 5 minutes or 15 minutes, and you will see many of the low point of rising stocks.
If want to prefer long term range trading, you can set the time frame to 1 hr or 1 day.


Strong Sell signal on AAPL with high probability!Hello ladies and gentlemen, according to my graphical analysis of Apple Stock, there is a high probability of a decline towards the 154$ level in the next few weeks!

#AAPL Trading The WXY PatternIn this update we review the recent price action in Apple and identify the next high probability trading opportunity and price objectives to target
PAST PERFORMANCE NOT INDICATIVE OF FUTURE RESULTS

Apple: Trend-setting battle 🔥📈📉The bears have once again pushed Apple down to the lower border of the green target zone between $170.89 and $185. We continue to believe that the stock is in an overriding uptrend, but for that to be the case, it now needs to climb higher. In this scenario, the white wave (III) is expected to end well above the resistance at $198.23. However, it is important to note that our alternative now has a relatively high probability of 41%. If the price were to fall below $167.62, the first task would be the grey wave (IV).

Apple short term bounce.The RSI shows a bullish divergence and the RCI has a triple bottom. A good setup for a short term bounce before continuing probably its descent.

APPLE Last BUY opportunity before a new 18 month expansion.Last time we looked into Apple (AAPL), it was still trading within the 2023 Channel Up (see chart below) and gave us an excellent technical pull-back buy opportunity:
This time the stock is after a 3-month pull-back that is testing the 1W MA50 (blue trend-line) for the first time since the week of March 13. On the wider picture of Apple in the last 10 years (1W time-frame), such pull-backs have been nothing more that consolidation phases before the next Expansion (usually 18 month - green arrows) that leads to the eventual peak and a new yearly correction (red arrows).
Those consolidation phases find Support on the 1W MA50 (even the COVID crash broke it just marginally), unlike the yearly corrections which find on the 1W MA200 (orange trend-line). What's astounding is the frequency of the consolidation pull-backs, which can be very effectively displayed with the use of the Sine Waves. As you can see on our chart, in the last 10 years, all pull-backs to the 1W MA50 after a 1W MA200 rebound, are located at the bottom of the Waves.
This indicates that most likely the current one is over and investors are expected to 'ride' the new 18-month Expansion wave to the new All Time High.
-------------------------------------------------------------------------------
** Please LIKE 👍, FOLLOW ✅, SHARE 🙌 and COMMENT ✍ if you enjoy this idea! Also share your ideas and charts in the comments section below! This is best way to keep it relevant, support us, keep the content here free and allow the idea to reach as many people as possible. **
-------------------------------------------------------------------------------
💸💸💸💸💸💸
👇 👇 👇 👇 👇 👇

AAPL-Dmnd zone 4h Long if break AAPL will go Long if it breaks through supply. Hopefully we see something by the end of this week maybe next week if the market doesn’t fail demand. Good luck, let’s see how it plays out. Looks good on 1 month/3m time frame

AAPL fractalThis whole year has been sort of a fractal for 2020 through 2022 for AAPL. Kind of crazy if you look at it. Lots of 5 wave falling wedges this year, and actually 2022 was one big falling wedge, sort of.
Expecting one more drop and then it's bull market back on. Can't believe I'm saying that but that's what the charts say.

Bull Flag Forming on Apple ($AAPL) Apple has been trending in the channel outlined in yellow lines. Short term it broken descending resistance which is a bullish move.

APPLE rebounding on the MA200 (1d). Eyes on 190.Apple is trading inside a Falling Wedge pattern, which yesterday met its MA200 (1d) and rebounded.
This put a stop to the bearish leg's downtrend and as long as the MA200 holds, the wave count can break over the top of the Wedge.
Trading Plan:
1. Buy on the current market price.
Targets:
1. 190.00 (September 5th High, Fibonacci 0.786).
Tips:
1. The RSI (1d) is on a Rising Support throughout the course of the Falling Wedge. This is a strong Bullish Divergence.
2. The MA200 (1d) has been intact since March 2nd.
Please like, follow and comment!!
Notes:
Past trading plan:

AAPL Announces New Event for Upcoming Mac Computers Apple Inc. (AAPL) has recently announced an upcoming event that promises to unveil a groundbreaking range of Mac computers, and I couldn't wait to share this thrilling development with you.
As an avid trader, you're well aware of the immense impact Apple has had on the tech industry, consistently pushing the boundaries of innovation. With this new event on the horizon, AAPL is poised to once again redefine the landscape of personal computing, and the potential for extraordinary growth is undeniable.
Apple's unwavering commitment to excellence, coupled with its ability to capture the imagination of consumers worldwide, has consistently propelled its stock to new heights. This event is expected to be no different, and I firmly believe that now is the perfect time to consider a long position on AAPL.
By investing in AAPL, you'll be positioning yourself at the forefront of this exciting wave of innovation. Apple's Mac lineup has long been revered for its sleek design, powerful performance, and seamless integration with the broader Apple ecosystem. The upcoming event promises to introduce cutting-edge advancements that will undoubtedly captivate consumers and drive significant demand for these new Mac computers.
As an astute trader, you understand the importance of staying ahead of the curve. By long AAPL, you'll not only be capitalizing on the imminent surge in demand for these revolutionary Mac computers but also positioning yourself to benefit from Apple's robust ecosystem, which includes an array of complementary products and services.
So, let's seize this opportunity together! I encourage you to carefully consider a long position on AAPL as we eagerly await the unveiling of these new Mac computers. By doing so, you'll be leveraging the potential for substantial gains while aligning yourself with one of the most innovative and influential companies in the world.
If you have any questions or require further information, please don't hesitate to reach out by commenting below. I'm here to assist you in any way I can.

AAPL Break Might be Coming Short AAPL 173
Stop 179
Target 160
AAPL has been setting up for a possible break for a while and we might be heading into it now. Swings breaking 1,61 supports can be especially strong.

Apple last daily analysis!Hello ladies and gentlemen, according to my graphical analysis of Apple Stock, we note that since August 2023, Apple Stock has entered in a downtrend until today, approaching a very strong support at the level of 172.00$

AAPL is going to 166 $ ? 📉🫣At this condition and situation of world health issues we can expect to experience a Bearish move on AAPL stock .
Good luck my friends

AAPL → TWO short positionshello guys...
as you can see appl is on the descending channel as well.
Before that made two divergences by RSI!
there are two opportunities for getting a short position and I draw it!
_______________________________
always do your research.
If you have any questions, you can write them in the comments below, and I will answer them.
And please don't forget to support this idea with your likes and comment

AAPL | Day Trading | 10-24-2023NASDAQ:AAPL
Trend & Moving Averages:
Trend: The general trend appears to be bearish, as prices are descending over the duration of the chart.
Moving Averages: There's a clear crossover of the short-term orange moving average below the longer-term blue moving average, further confirming the bearish sentiment.
Support & Resistance:
Bearish Line: The chart shows a bearish trendline that the price is attempting to break above.
Bullish Line: A bullish trendline also exists, indicating levels where the price has found support in the recent past.
Support: The stock appears to have solid support at the "Target Price 2" level around 169.93 USD.
Resistance: Resistance seems to be at the "Target Price" level around 174.72 USD.
Candlestick Patterns & Price Action:
The last few sessions demonstrate a mix of bullish and bearish candlesticks, suggesting volatility and indecision.
The latest candle (on 24th) is a small bullish candle. If it's followed by another strong bullish candle, it could signal a potential short-term reversal.
Volume:
Volume Profile: The volume appears to be relatively stable with some spikes. Notably, there is a significant volume spike on the last day. High volume accompanying a price movement can be a strong indicator of the strength of that movement.
The most recent bullish candle is accompanied by a notable increase in volume, which could indicate strong buying interest.
Notable Price Levels:
Bullish Line: The stock is trading close to this line. A break above this line could suggest a short-term bullish sentiment.
Bearish Line: If the stock moves downward and breaks this line, it could indicate further bearish sentiment.
Target Prices: These are potential price points where the trader expects the stock might move to. It's important to watch these levels as they can act as psychological levels of support or resistance.
Summary:
The Apple Inc. chart portrays a bearish trend with potential signs of a short-term reversal, given the recent bullish candle with high volume.

AAPL Bear Swings ForecastAAPL looks like it might be setting up a break.
For a break I'd want to see 155 hitting at least. Maybe some bounce in this area to 165 and then from there us trading around 150.
If these swings hit, I think we'll rally off them. I'm probably a buyer at 150 - but I think we'll have seen a break.
It may take multiple months to set up after, but I think this would signal AAPL entering a bear market.
