ABIT trade ideas

Anheuser-busch inbevAb inbev bounced at a weekly resistance, and i think it could be going back up again to 100+ if the 4h trend turns strongly bullish im considering it a buy.

$BUD Oversold at Support - $1.2M Call Buyer$BUD Oversold at Support - also significant CALL buyer today betting $1.2M on 3,450 $100 strike Sept 21st expiration calls.
Note: Earnings release next week 05/09.


XPloRR MA-Trailing-Stop Strategy on AB-Inbev(ABI) beats Buy&HoldLong term MA-Trailing-Stop strategy with Adjustable Signal Strength to beat Buy&Hold strategy
None of the strategies that I tested can beat the long term Buy&Hold strategy. That's the reason why I wrote this strategy (link see below).
Purpose: beat Buy&Hold strategy with around 10 trades over a period of 10 years (average of 1 trade/year). 100% capitalize sold trade into new trade.
My buy strategy is triggered by the fast buy EMA (blue) crossing over the slow buy SMA curve (orange) and the fast buy EMA has a certain up strength.
My sell strategy is triggered by either one of these conditions:
the EMA(6) of the close value is crossing under the trailing stop value (green) or
the fast sell EMA (navy) is crossing under the slow sell SMA curve (red) and the fast sell EMA has a certain down strength.
The trailing stop value (green) is set to a multiple of the ATR(15) value.
ATR(15) is the SMA(15) value of the difference between the high and low values.
The script shows a lot of graphical information:
One green area represents one trade
The close value is shown in light-green. When the close value is lower then the buy value, the close value is shown in light-red. This way it is possible to evaluate the virtual losses during the trade.
the trailing stop value is shown in dark-green. When the sell value at the end of the trade is lower then the buy value, the last color of the trade will be red (best viewed when zoomed)
the EMA and SMA values for both buy and sell signals are shown as a line
the buy and sell(close) signals are labeled in blue
How to use this strategy?
Every stock has it's own "DNA", so first thing to do is tune the right parameters to get the best strategy values voor EMA , SMA, Strength for both buy and sell and the Trailing Stop (#ATR).
Look in the strategy tester overview to optimize the values Percent Profitable and Net Profit (using the strategy settings icon, you can increase/decrease the parameters)
Then keep using these parameters for future buy/sell signals only for that particular stock.
Do the same for other stocks.
Important : optimizing these parameters is no guarantee for future winning trades!
Here are the parameters:
Fast EMA Buy: buy trigger when Fast EMA Buy crosses over the Slow SMA Buy value (use values between 10-20)
Slow SMA Buy: buy trigger when Fast EMA Buy crosses over the Slow SMA Buy value (use values between 30-100)
Minimum Buy Strength: minimum upward trend value of the Fast SMA Buy value (directional coefficient)(use values between 0-120)
Fast EMA Sell: sell trigger when Fast EMA Sell crosses under the Slow SMA Sell value (use values between 10-20)
Slow SMA Sell: sell trigger when Fast EMA Sell crosses under the Slow SMA Sell value (use values between 30-100)
Minimum Sell Strength: minimum downward trend value of the Fast SMA Sell value (directional coefficient)(use values between 0-120)
Trailing Stop (#ATR): the trailing stop value as a multiple of the ATR(15) value (use values between 2-20)
Example for AB-Inbev (ABI) (Start capital: 1000, Order=100% of equity, Period 1/1/2005 to now) compared to the Buy&Hold Strategy(=do nothing):
Fast EMA Buy=9
Slow SMA Buy=30
Minimum Buy Strength=40
Fast EMA Sell=16
Slow SMA Sell=63
Minimum Sell Strength=40
Trailing Stop (#ATR)=8
Result: 2.27 times better than Buy&Hold strategy
NetProfit: 1002%
#Trades: 11
%Profitable: 63%
Buy&HoldProfit: 440%

ABI Got amazing Profit? can go for a rally?ABI Got amazing Profit? can go for a rally? based on previous support becomes resistance? If its breaks then can go next All time high?


anheuser-bush inbevInteresting aggressive long entry based on medium term support line proximity and bullish weekly candle.

Short IdeaAnheuser-Busch InBev SA/NV is engaged in the production, marketing, and distribution of beer and other malt beverage brands. Its brands includes Budweiser, Corona, Stella Artois, Beck’s, Leffe, Hoegaarden, Castle Lager and others. The Company is listed on the New York Stock Exchange.
Price chart breaking down over a year long Bearish Flag. Wait for the weekly close to confirm the move and sell on weekly closing basis. Measured Price Target comes at 88.72 if the current candle close below the lower boundary of the flag, alternatively a weekly close inside the flag will negate the bearish bias .

2017-11-19 - AB INBEV - Go long and trade the rangeThe stock is currently trading at the bottom of the weekly range.
The Price of Control is currently 99.0, the stock is currently trading below this price.
The average volume (8 period) on the weekly is stable, so the area is accepted.
The same period average volume on the daily is slightly increasing as price dropped, so it looks like buyers are coming in at the lower prices.
The perfect entry would be below 96.76.


ARBITRAGE SELL PEPSICO BUY ANHEUSER BUSCHBoth giant has similar market cap, PE ratio and global exposure.
PERCENTAGE GAP CAN NARROW WITHIN 6-9 MONTHS


AB InBev: breaking the red resistance lineAB InBev's share price drops since a few weeks. Now we see that the share price recovers by breaking a declining line a in main indicator that follows the track of stocks. But more interesting is the positive divergence, indicating the negative momentum turns to a positive momentum supported by hammers. Nevertheless an inverted hammer can delay the advance of the share price. The first targets are the 100.95, 102.70 and the 104.43. The bulls are in the best position to begin an uptrend.


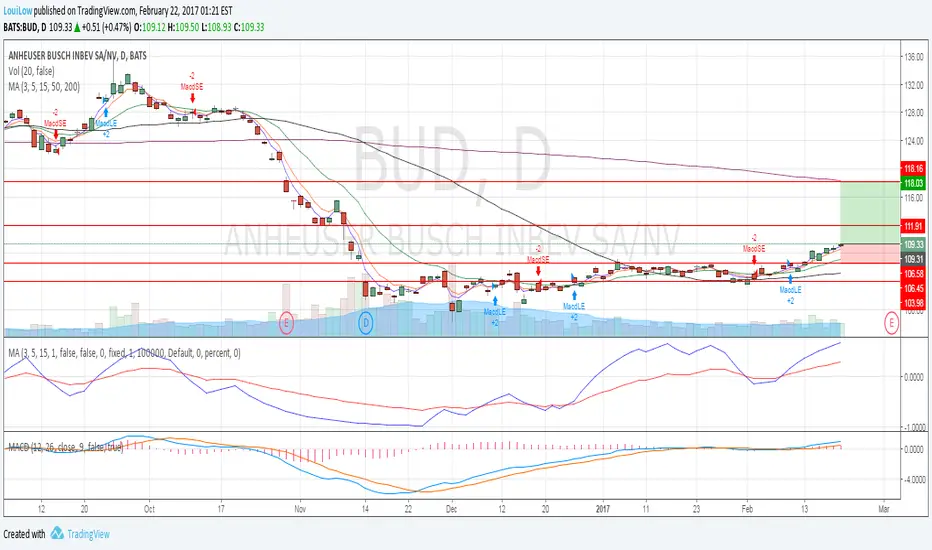
Looking on the positive side of things after the correctionPrice may be on a recovering position after the correction phase since last year October.
Price may be revisiting the resistance of US$111.91 and US$118.16 (SMA200).
Support will be set around US$106.58, followed by US$103.98
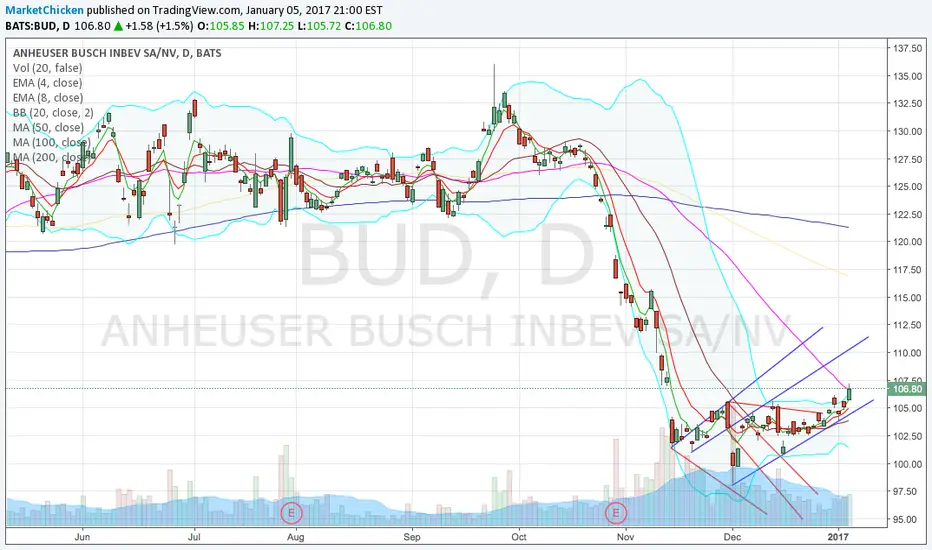

BUD doesn't like autumnIt's not exact, but BUD tends to tank around Oct-ish then wend it's way back. @rahagar @commonking


4 ema kissing the 8 ema@rahagar Plenty of room on rsi/macd for higher. If mkt pulls back this will pb also, vol still low on this. Thoughts?
