AMGN trade ideas


AMGEN INC: The easy winThe gain in this stock market really comes easy: two simple actions should be taken:
Firstly: we enter the market via a long position
Secondly: we close and sell our position because the market is starting to go down.
The appropriate time of each action is indicated in the chart especially the candles.
Traders who are interested in this recommendation: write in comments.


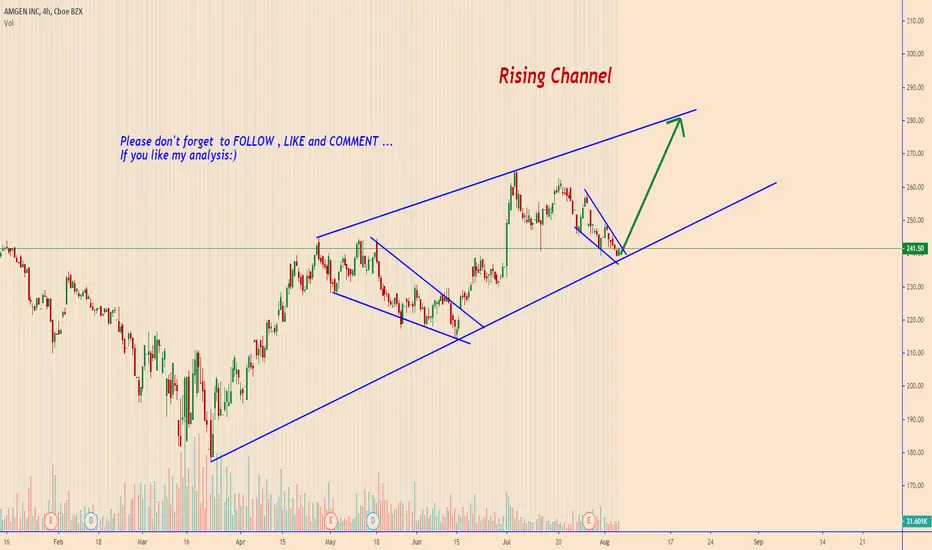
AMGN: Rising ChannelRising Channel
Please don't forget to FOLLOW , LIKE and COMMENT ...
If you like my analysis:)
Thank you and good luck
Long AMGN 240 good supportTrendline support is solid on the $240 level
Strong lower wick and buying last month on the 240 area.


$AMGN Amgen Long Into earnings
Potential earnings trade setup.
$245 breakout level has now held as support
on a back-test with good volume .
Upside Fibonacci target $270.00
PLEASE GIVE US A LIKE IF YOU FIND OUR CONTENT HELPFUL, THANK YOU.

AMGEN SELLstocks market are under the pressure of fear of 2nd wave and again LOCKDOWN.
If you found this analysis useful, please like it and share it with others


Amgen Just Broke Out. Now it’s Bouncing.Biotechnology has quietly moved up the industry rankings in the last month. We recently highlighted the long-term breakout in the iShares Nasdaq Biotechnology ETF and now its biggest holding (8% of assets) has some interesting patterns: Amgen.
AMGN broke out to new highs in late 2019 and crashed along with the rest of the market in March. It then proceeded to make a higher low in June as it found support at its 200-day simple moving average (SMA). This produced a cup-and-handle chart pattern.
The stock had a tight bullish flag above its 50-day SMA in late June, and then ripped to new highs after winning a patent case against Novartis.
AMGN pulled back last week. It formed a hammer candlestick on Friday and is now bouncing at its 8-day exponential moving average (EMA). That line can serve as a potential risk-management area.
There are two reasons why it may not dip a lot more. First, AMGN hasn’t run much yet versus its December highs. So, there may not be many profit-takers yet. Second, the relative strength in IBB following its recent breakout could provide tailwinds.
AMGN reports earnings after the closing bell on July 28.

Bull Flag?Possible Bull flag after sharp pull back
Hypothetical targets are 270 285 295
Not recommending the stock!
Go with your gut


Based off past years of performanceThis seems to be a good stock to hold for the long term. It has high dividends and pretty stable growth. As of now, it is in my watchlist as I am hoping for a lower point to buy-in $(220-230) range but more likely $230 as I do not want to miss this stock.

$AMGN Amgen Breakout Target $280
Huge breakout today which stalled at Fibonacci extension targets
May get a slight pullback but long term target is in the $280 zone

BUY To AMGENHello traders, AMGEN is on a bullish slant, large volume of sales made in recent days. it can break the trend line and the consolidation zone.
Please LIKE & FOLLOW, thank you!

Inverse Head & ShouldersFirst time on putting an idea on here..so please bear with me (o:
Entry: 235
Stop: Below 224
Target 1: 270 to 279
Target 2: 307 to 327
Good luck!

Steady growth and good dividendndsSeem to have a good track record, especially by increasing dividends annually makes me interested in buying in once/ if it hits 200

