Picking a WinnerWorking on Wall Street. and on track to getting my stockbroker license, I might as well start analyzing stock prices. this seems like it will be a good trade in its due time...
GILD.USD trade ideas

long GILD play before and after earningsGILD is a value stock with cheap P/E. it broke downtrend recently and it may be a start of long uptrend. last 2 weeks were good volumes in this stock for an uptrend.
long with target price 75.9 before earnings. after earnings it could drop to 69 and if it holds 69 it can go up to 80.

Long GILD callsGild had a nice pullback from its run up and I have purchased September calls. Targeting the 73.50 area. Proven wrong below 68.


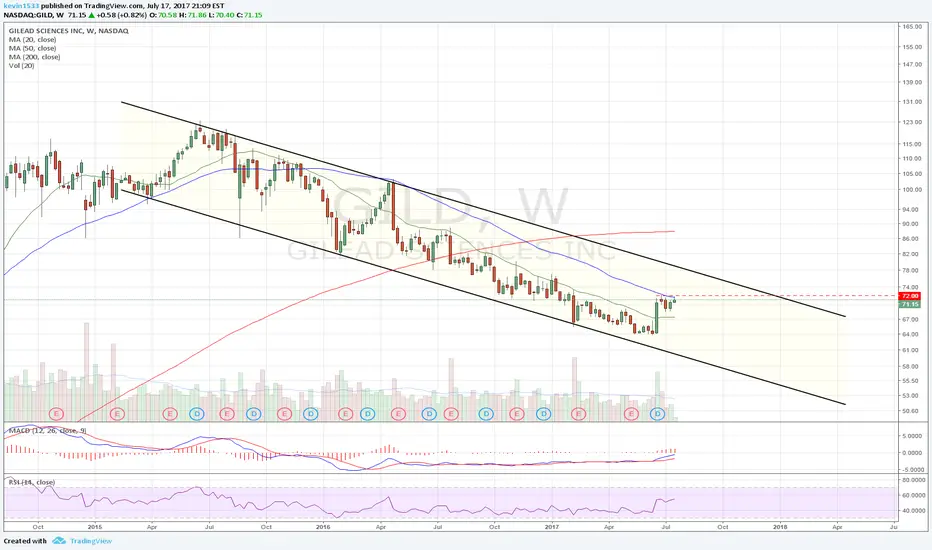


Gilead / GILDLooks to me like it retraced 62% over the last couple of years and it's now on the brink of a trend change with 1) a potential bullish monthly MACD crossover and 2) a potential break out above a 2 year falling wedge. This hypothesis assumes $64 is the bottom. $76 looks like the first step followed by $87. GLTA!!


GILD bounces from all-time low since year 2014. A BUY.1. Fundamental = Buy.
2. Technical = Buy.
3. News/Rumors = Buy.

A Potential Entry Point For Gilead Sciences (GILD)Gilead Sciences went down in the last couple of year by almost 50%, and compressed into a 3-year old demand zone. As you can see on the weekly chart, the price has compressed nicely into this zone in the last few weeks. 2 weeks ago there was a very strong price action from the bottom of the zone, in the form of a big engulfing bullish candle. A similar candle can be seen on the monthly chart (the monthly candle of June).
Last week closed with hesitation, and now it's time to wait and see whether the price will retrace a bit down to give a better entry point for new buyers. I drew a line on the weekly chart, but it's basically based on the daily chart, where you can see a trendline, which starts as support, then turns to resistance, and now that it's been breached up, it could serve as support again, should the price come back down and test it.
This is the area of entry - roughly around $66-67, with a stop below the demand zone (around $60) and a potential profit somewhere around $82-85. So a risk of ~10% can potentially yield a reward of ~22-27%.


GILD Short It will be difficult for GIld to continue the rally against a major trend down, first sign of selling will create panic for longs

closed above 2016 support levelslike $73 Q end close on Friday. 1,000 Aug 72.5 calls BTO $2.28 on Ask.


Past support is now resistance.Funny how it always works that way. Banked some profits today. Waiting new weekly highs to BTO new calls.


$GILDAnother biotech to add to our basket. I'm bullish on gild after a weak few months, 7x earnings excluding r&d with the fortress HIV providing most of cash flow.
Large cap with almost 100% upside
All the best.


GILD on track for yearly highsSimple analysis - after a 3 wave pullback lasting near to exactly 2 years after the all time high, GILD is bouncing off support and looks ready to make a nice move north with the fib lines as targets. RSI has also broken out for the first time this year; and more confidence will come on the break of the daily 200 EMA .

