GILD.USD trade ideas


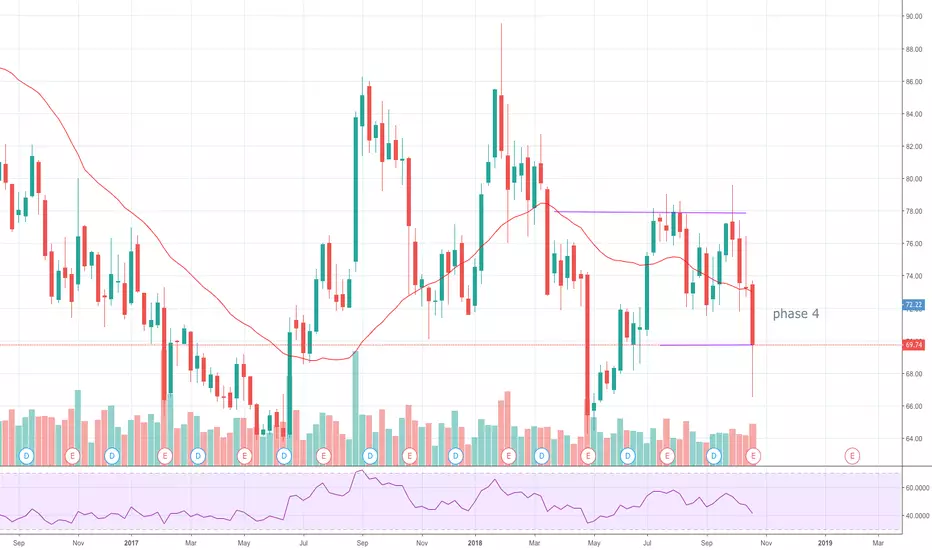
[GILD] phase 4 -> don't buyThe price fell 372 pp! The slope of 30MM is negative and we see clearly a resistance. Don't buy.
Scalper - GILD - 15m chart - Oct 19, 2018Based on my proprietary indicator (in testing mode):
Long
Entry on green arrow
Exit on red arrow or stop loss or target hit
Short
Vice versa

GILD getting attention againGILD just broke the ichi cloud and heading toward a break out point. Money has been moving back into heath/bio stocks.
Never completed the three drive of my previous post but looks strong here.

GILD: Sort opportunityAn intraday high potential, Back Tested Sort Analysis.
We ll try to enter into the correction of the uptrend movement.
DETAILS ON THE CHART
NOTE: Entry range area above the entry point, is calculated upon 80% of the recorded pullback back tested past performances
DISCLAIMER: This is a technical analysis study, not an advice or recommendation to invest money on.


GILDBroke through double bottom neckline and EMAs curling upwards convincingly. This is looking very bullish.


GILD - LongMy average price on this is 76.49, so I'm down a little currently, but I think it finally might be ready to move higher.

GILD for a Long PlayShares of GILD have recently broken out above resistance around $74 and have since successfully tested and held it as support (dashed green line) on two different occasions.
They look destined to at least test the falling trend line (red line), and I think there's a good chance we break through that resistance to establish a new trend higher.
I'm a buyer via calls, specifically the November $80 calls because they will carry me through the next earnings report. That's not to say I'll hold them through the release, but I suspect premiums will elevate leading in to the report and that should help bolster the bullish position.


GILD - Turns on supportTurns on support 71.90$ , support FIB 0.5 = 71.64$
resistance MA200 D =73.80$

GILD: No such thing as Double Bottoms? Im a Rookie so dont hateOn weekly chart seeing a trend line from the high as strong resistance and has 2 touches and looks like might be a 3rd to confirm it. Also, on TD the count is on 8 which means we should see a slow down which gives me more faith in the trend line. The Daily on the TD is on a corrective sate completing a 9 and into couple days of correction so i think it coincides with the weekly, we should see another 9 days of up and then should run into the weekly 9 and then another correction.
My thoughts is it touches the trend @ 78.60 ish goes down to test support @64 and then a decision is made if it holds or breaks.

Could we be on course for a major collapse in GILD?I think so. My analysis points to a rapid decline to the 55 region by Feb next year


Gilead Sciences: fighting competitive headwinds?One of the things that analysts are watching out for is the impact of patent expirations on the company's revenue and margin. Gilead's HIV franchise saw the first important patent expirations in 2017, and the firm needs to convert patients to newer products like Genvoya and Biktarvy to avoid a significant hit to sales.
Gilead generates stellar profit margins with its HIV and HCV portfolio, which requires only a small salesforce and inexpensive manufacturing. What Gilead needs to drive business further is HCV market stabilization, strong continued innovation in HIV, solid pipeline data, and smart future acquisitions to return to growth.
www.finstead.com

GILD. LongAnalyst concensus PT $86.5, and breaking the most recent $77.00 resistance. An 8.43 upside from recent support.


GILD - wave 5 in progressIf this is not a perfect demonstration of Elliott Wave Theory, I don't know what else would be.
- Wave 2 measures exactly 61.8% of wave 1
- Wave 3 is exactly at 161.8% of 1
- Wave 4 is exactly at 38.2% of wave 3.
- Inside zigzag 4, c is exactly 123.6% of a.
- Plus the yellow resistance box failed to break out.
- Plus OBV was going no where when price moved from 64 to 72 (labeled as 4).
It looks like wave i of 5 is forming as a leading diagonal and not a bullish flag (in which case resistance will be broken and stop loss will need to trigger).
Stop loss can be placed very tightly at 72.50
Traditional target for wave 5 is just below 60.
