AU200AUD short term RSI has turned positive.ASX200 - 24h expiry
The correction lower is assessed as being complete.
Short term RSI has turned positive.
Further upside is expected.
Risk/Reward would be poor to call a buy from current levels.
A move through 7825 will confirm the bullish momentum.
We look to Buy at 7775 (stop at 7735)
Our profit targets will be 7875 and 7895
Resistance: 7825 / 7850 / 7875
Support: 7800 / 7775 / 7750
Risk Disclaimer
The trade ideas beyond this page are for informational purposes only and do not constitute investment advice or a solicitation to trade. This information is provided by Signal Centre, a third-party unaffiliated with OANDA, and is intended for general circulation only. OANDA does not guarantee the accuracy of this information and assumes no responsibilities for the information provided by the third party. The information does not take into account the specific investment objectives, financial situation, or particular needs of any particular person. You should take into account your specific investment objectives, financial situation, and particular needs before making a commitment to trade, including seeking advice from an independent financial adviser regarding the suitability of the investment, under a separate engagement, as you deem fit.
You accept that you assume all risks in independently viewing the contents and selecting a chosen strategy.
Where the research is distributed in Singapore to a person who is not an Accredited Investor, Expert Investor or an Institutional Investor, Oanda Asia Pacific Pte Ltd (“OAP“) accepts legal responsibility for the contents of the report to such persons only to the extent required by law. Singapore customers should contact OAP at 6579 8289 for matters arising from, or in connection with, the information/research distributed.
AUS200 trade ideas

Will Australia overcome the triple top?The Australian session has started on a positive note with both annual and quarterly retail sales in positive territory on an annual basis (previous 4.1% vs. 1.5% today) and showing a correction although still in negative territory on a quarterly basis (previous -1.9% vs. -0.3% today). Australian PMI data showed a slight decline. The Australian Federal Reserve's (RBA) consumer inflation expectations are for a slight correction from the previous 4.6% vs the current 4.5%. Tonight's session may confirm slightly downward consumer confidence, if the consensus exports, trade balance and imports are as positive as presented and show an acceleration of the Australian economy. The RBA currently has estimated consumer price inflation at around 3.6%, the previous indicator being 3.5% and the cash lending rate target is at 4.35% based on May 8 data. The truth is that we have a scalextric of emotions with interest rate expectations over Australia, and the truth is that the Australian Federal Reserve is keeping the door open to rate hikes of 0.25% in its next meetings, looking for 2024-25 to target 2.75% and not 3.5%, and looking to reach 2.5% by 2026 onwards.
The S&P/ASX 200 has shown to remain strong in the highs zone and it is also partly a result of the fact that some of its companies have a very strong correlation with the gold market which is currently in the highs zone as well as silver, which has doubled its value during this 2024 (45.41%), as well as gold has risen by 24.39%. The metals and Gas markets are very important for Australia as an exporter of technologies for these markets and one of the main suppliers of LNG to Asia.
Looking at the chart, it is currently at 7,831.16 points, with a high of 7,927.42 points and a low of 6,734.52 points. The development of the index has been slightly upward limping.
If we look at market expectations, it would not be unusual to see a growth of the Australian index. The RSI is in its middle zone at 56.70% while the price bell that has formed on the daily level is dual, and heavily weighted on the current price zone which is between highs and 7,392.34 points. If the triple top is breached we could see a new round of bullish sessions. But it is more likely to see a correction to 7,392.34 than the overcoming of such strong resistance.
Ion Jauregui - AT Analyst
*******************************************************************************************
The information provided does not constitute investment research. The material has not been prepared in accordance with the legal requirements designed to promote the independence of investment research and such should be considered a marketing communication.
All information has been prepared by ActivTrades ("AT"). The information does not contain a record of AT's prices, or an offer of or solicitation for a transaction in any financial instrument. No representation or warranty is given as to the accuracy or completeness of this information.
Any material provided does not have regard to the specific investment objective and financial situation of any person who may receive it. Past performance is not reliable indicator of future performance. AT provides an execution-only service. Consequently, any person acing on the information provided does so at their own risk.

AUS200 (Long Setup)Everything has mentioned in the chart.
Buying divergency on 4H time frame.
Hammer on demand Zone
Buying volume increasing
Target the current supply zone.
wait for price to get to the demand zone again.
thank you for reading.

AU200AUD to form a higher low?AU200AUD - 24h expiry
There is no clear indication that the upward move is coming to an end.
Although we remain bullish overall, a correction is possible with plenty of room to move lower without impacting the trend higher.
Risk/Reward would be poor to call a buy from current levels.
A move through 7800 will confirm the bullish momentum.
The measured move target is 7850.
We look to Buy at 7760 (stop at 7720)
Our profit targets will be 7860 and 7885
Resistance: 7800 / 7835 / 7850
Support: 7775 / 7760 / 7750
Risk Disclaimer
The trade ideas beyond this page are for informational purposes only and do not constitute investment advice or a solicitation to trade. This information is provided by Signal Centre, a third-party unaffiliated with OANDA, and is intended for general circulation only. OANDA does not guarantee the accuracy of this information and assumes no responsibilities for the information provided by the third party. The information does not take into account the specific investment objectives, financial situation, or particular needs of any particular person. You should take into account your specific investment objectives, financial situation, and particular needs before making a commitment to trade, including seeking advice from an independent financial adviser regarding the suitability of the investment, under a separate engagement, as you deem fit.
You accept that you assume all risks in independently viewing the contents and selecting a chosen strategy.
Where the research is distributed in Singapore to a person who is not an Accredited Investor, Expert Investor or an Institutional Investor, Oanda Asia Pacific Pte Ltd (“OAP“) accepts legal responsibility for the contents of the report to such persons only to the extent required by law. Singapore customers should contact OAP at 6579 8289 for matters arising from, or in connection with, the information/research distributed.

AUS2001) Range breakout
2) Aus200 Printing HH and HL
Move your Stop Loss to the Entry Point when TP 1 get hit.


ASXAUD Forrex This Chart was printing a Bearish trend line but there is a Divergence so it will Print a Bullish trend with Ascending Continuous Pattern
The Entry Point will be instant Buy Stop .
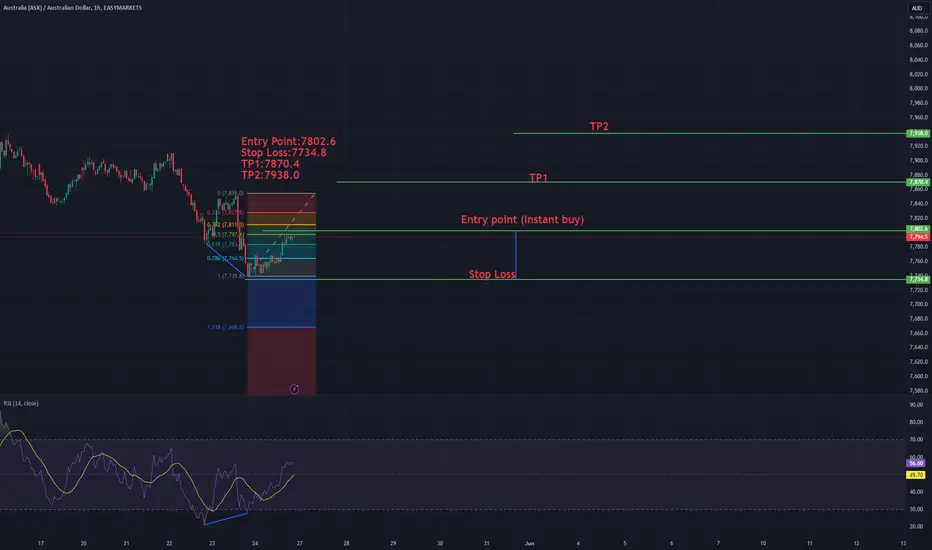
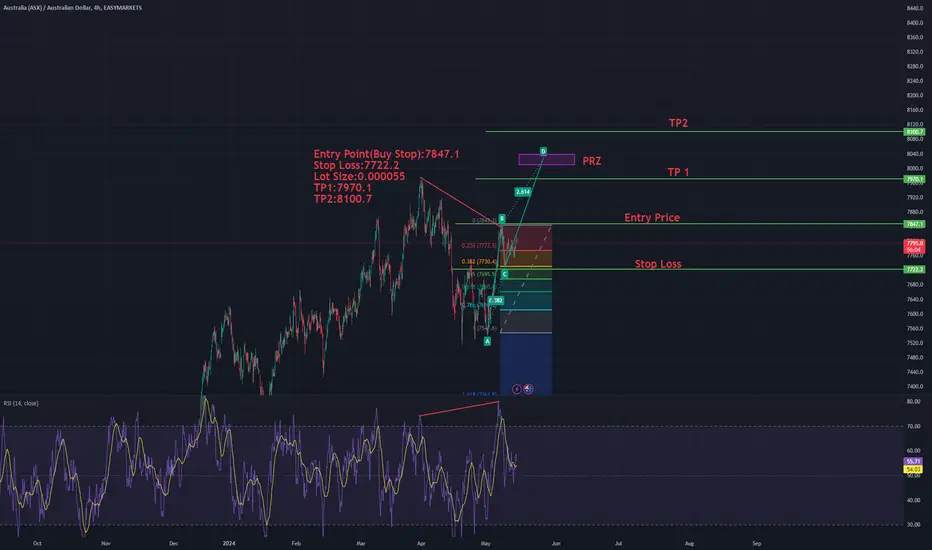
ASXAUD Index chartThis Chart shows a bullish trend as its making a divergence and after the trend is break it will make a Bearish Trend which mentioned D point Which is called Potential Reversal Zone .
Entry Point(Buy Stop):7847.1
Stop Loss:7722.2
Lot Size:0.000055
TP1:7970.1
TP2:8100.7
AUS200 Buy Side Money Heist PlanMy Dear Robbers / Traders,
This is our master plan to Heist Bearish side of AUS200 cash index Market based on Thief Trading style Technical Analysis.. kindly please follow the plan I have mentioned with target in the chart focus on Long entry, Our target is Red Zone that is High risk Dangerous area market is overbought / Consolidation / Trend Reversal at the level Bearish Robbers / Traders gain the strength. Be safe and be careful and Be rich.
Loot and escape on the target 🎯 Swing Traders Plz Book the partial sum of money and wait for next breakout of dynamic resistance level, Once it is cleared we can continue our heist plan to next target.
support our robbery plan we can make money & take money 💰💵 Join your hands with US. Loot Everything in this market everyday.

ASX to continue in the upward move?AU200AUD - 24h expiry
There is no clear indication that the upward move is coming to an end.
Although we remain bullish overall, a correction is possible with plenty of room to move lower without impacting the trend higher.
A lower correction is expected.
Risk/Reward would be poor to call a buy from current levels.
A move through 7800 will confirm the bullish momentum.
We look to Buy at 7750 (stop at 7718)
Our profit targets will be 7830 and 7850
Resistance: 7800 / 7825 / 7850
Support: 7775 / 7750 / 7725
Risk Disclaimer
The trade ideas beyond this page are for informational purposes only and do not constitute investment advice or a solicitation to trade. This information is provided by Signal Centre, a third-party unaffiliated with OANDA, and is intended for general circulation only. OANDA does not guarantee the accuracy of this information and assumes no responsibilities for the information provided by the third party. The information does not take into account the specific investment objectives, financial situation, or particular needs of any particular person. You should take into account your specific investment objectives, financial situation, and particular needs before making a commitment to trade, including seeking advice from an independent financial adviser regarding the suitability of the investment, under a separate engagement, as you deem fit.
You accept that you assume all risks in independently viewing the contents and selecting a chosen strategy.
Where the research is distributed in Singapore to a person who is not an Accredited Investor, Expert Investor or an Institutional Investor, Oanda Asia Pacific Pte Ltd (“OAP“) accepts legal responsibility for the contents of the report to such persons only to the extent required by law. Singapore customers should contact OAP at 6579 8289 for matters arising from, or in connection with, the information/research distributed.

ASX200 - the bulls in control for now Everyone is talking about the moves in the FTSE100, but the ASX200 is having a moment - we see solid rate of change, the index is still no where near overbought, and we see 4 days of rising range expansion. Momentum is clearly to the upside, which suggests dips should well supported and shallow - hard to be short on timeframes 4hr+ and favour this higher but a move below the former breakout area of 7723 and I would be more cautious.
(Thoughts from Chris Weston)

AUS200 Soars Towards Yearly Highs Amid Strong Resistance ZonesHello Everyone,
The AUS200 is showing signs of upward momentum, reaching a fresh weekly peak at 7818.57. There's optimism in the market to challenge the yearly high at 7929.90 and potentially exceed it. The current setup looks promising, but it's worth noting that significant resistance levels lie ahead at 7817.805, 7859.268, and 8107.547.
TradeWithTheTrend3344

AUS200 is moving toward trend reversal.Chart is showing completion of Butterfly pattern. At PRZ we can observe divergence which is also indication of trend reversal so we can take entry according to our trade plan once it start making new ll's and lh's.

$XJO #ASX200 Under Threat from Head & Shoulders Pattern?The #ASX200 index, here on the Daily chart, could be under the threat of a potential Head and Shoulders pattern. It seems as if a lengthy bearish divergence might be starting to play its role here too. If this is to play out, it could be the start for this index losing more than two thirds of its value according to TheDawieSetup.

AUS200A parallel channel, also known as a price channel or trend channel, is a technical analysis tool used to identify and visualize the direction and strength of a trend. It consists of two parallel trendlines that encompass price movement within a specific range over time.
Here's how a parallel channel is constructed:
1. **Upper Trendline:** This line connects the highs or peaks of the price movement, acting as a resistance level. It represents the upper boundary of the price channel.
2. **Lower Trendline:** This line connects the lows or troughs of the price movement, acting as a support level. It represents the lower boundary of the price channel.
When drawn correctly, these two trendlines should remain approximately parallel to each other, indicating a consistent trend direction.
Parallel channels can be classified into two main types:
- **Uptrend Channel:** In an uptrend channel, both the upper and lower trendlines slope upward. The price tends to make higher highs and higher lows within the channel, indicating bullish momentum.
- **Downtrend Channel:** In a downtrend channel, both the upper and lower trendlines slope downward. The price tends to make lower highs and lower lows within the channel, indicating bearish momentum.
Traders and analysts use parallel channels to:
- Identify trend direction: Channels help traders determine whether the market is trending upward, downward, or moving sideways.
- Gauge trend strength: The width of the channel can provide insights into the strength of the trend. Narrow channels may indicate a weakening trend, while wide channels suggest a strong trend.
- Identify potential entry and exit points: Traders may look for buying opportunities near the lower trendline in an uptrend channel and selling opportunities near the upper trendline in a downtrend channel.
It's essential to confirm the validity of a parallel channel pattern using other technical analysis tools and indicators to avoid false signals. Additionally, channels may evolve over time, so traders should regularly monitor and adjust their analysis accordingly.

AUS200: Bullish Long-Term, Watch for SwingsHello Everyone,
The long-term bullish sentiment on AUS200 remains intact! Should the price stabilize below the weekly pivot point, a downward movement could precede the anticipated upward swing. Notably, weekly support levels have demonstrated resilience thus far, suggesting a robust foundation.
TradeWithTheTrend3344

ASX dips continue to attract buyers.AU200AUD - 24h expiry
Price action looks to be forming a bottom.
Short term RSI is moving higher.
Further upside is expected.
Risk/Reward would be poor to call a buy from current levels.
A move through 7650 will confirm the bullish momentum.
We look to Buy at 7600 (stop at 7560)
Our profit targets will be 7700 and 7725
Resistance: 7650 / 7675 / 7700
Support: 7625 / 7600 / 7575
Risk Disclaimer
The trade ideas beyond this page are for informational purposes only and do not constitute investment advice or a solicitation to trade. This information is provided by Signal Centre, a third-party unaffiliated with OANDA, and is intended for general circulation only. OANDA does not guarantee the accuracy of this information and assumes no responsibilities for the information provided by the third party. The information does not take into account the specific investment objectives, financial situation, or particular needs of any particular person. You should take into account your specific investment objectives, financial situation, and particular needs before making a commitment to trade, including seeking advice from an independent financial adviser regarding the suitability of the investment, under a separate engagement, as you deem fit.
You accept that you assume all risks in independently viewing the contents and selecting a chosen strategy.
Where the research is distributed in Singapore to a person who is not an Accredited Investor, Expert Investor or an Institutional Investor, Oanda Asia Pacific Pte Ltd (“OAP“) accepts legal responsibility for the contents of the report to such persons only to the extent required by law. Singapore customers should contact OAP at 6579 8289 for matters arising from, or in connection with, the information/research distributed.

AUS200 index chart using reverse patternUAS200 pattern chart showing reverse pattern using H&S method...

AU200Buy above 7656
And Target 7795
Risk reward in your favour
Don't make complecated
Keep simple you can put your trade 1 ,2, 3 time but buy only above 7656
Keep giving small sl

XJO on major supportASX 200 Index (XJO) closed yesterday sitting on major support line @ 7603.
Long-term higher highs have previously been established since 2021 indicating overall positive market growth.

AUS200 Sees Support Breach Amidst Bullish OutlookHello Everyone,
The AUS200 has recently breached numerous support levels and is now approaching the yearly support and pivot point. However, buyers are beginning to enter the market. Despite this recent drop, the overall sentiment remains bullish, and a turnaround is anticipated shortly.
TradeWithTheTrend3344


XJO ripe for a punchy KOSo much negative divergence on XJO currently, it is ripe for a fall. Look how the last three higher highs have been when the MACD was making lower highs.
Let's see what triggers the fall, but with current US market reactions, this looks very soon.
