NL25EUR $NL25EUR Short ScalpNL25EUR $NL25EUR Short Scalp. TPs on chart. 50-200X leverage. Choose your own SL.
NED25 trade ideas

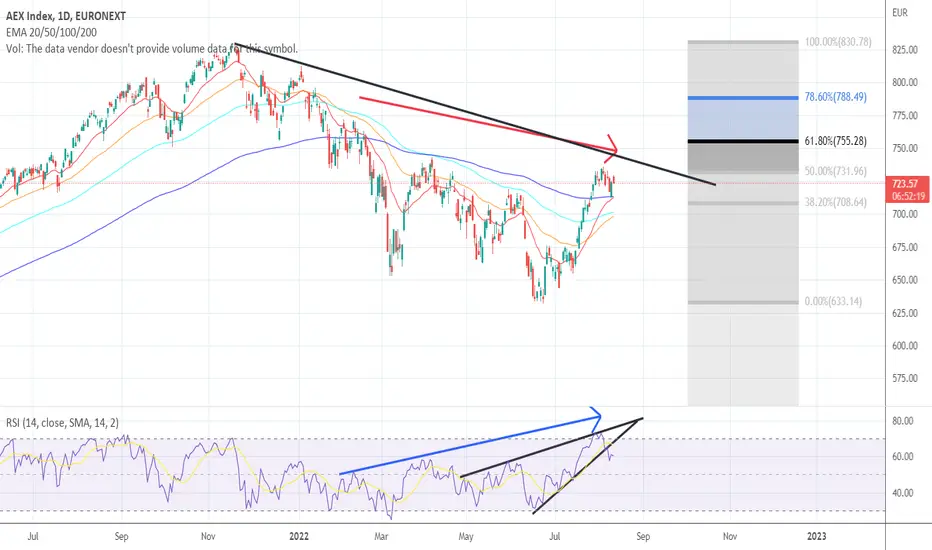
AEXSimple TA.
Trendline, Fibonacci 50° maybe till 61.8° and a hidden bearish divergence
The trend is still down. in other words, you can see this as a bearmarket rally.
In the RSI it broke the rising wedge pattern, maybe more going up for retesting that wedge (also means overbought)
A bearmarket rallly means new fresh money is needed before coming down again
Netherland buyInteresting 3 day to 1 week
Moving billions need time :)
Lookout for your fav setup. For me is to the upside
All the best.
Big cake. small bites


AEX naar de 750 ??fibonacci liegt niet zo te zien wellicht kan de AEX naar de magische 750 punten toe.
Fibo gaat richting de wave 5 en is op koers zo te zien. Staat de AEX in Augustus op 750 punten Who Knows

NL25EUR $NL25EUR Initial ShortNL25EUR $NL25EUR Initial Short. TP and SL on chart. Move SL on TP. After TP2, trail with 0.5ATR step and 1.5ATR offset.

The Lehman debacle Escape routePrinting money as an answer seems to come to an end as the global situation shows an escape route for the US.
My take on how to dim down inflation is to pull back the new money fast.
thus the Corona support money and possibly even what have been printed before the corona crisis when Lehman fell
this sudden value increase wil give a sense of success to the common man to inflation easing.
drawback is a big crash for the stock markets.
for the clastic banking system it's an win as Crypto wil totally collapse and the rules that will follow wil kill of the remainders.
meanwhile it's al blamed on the Russians ,,great.

NETH25 Long going long from this area. if price dumps I'll wait for another entry at same entry price

H&S Pattern has emerged on the Netherlands 25Pretty self explanatory, TP spot has been identified as the distance from the top of the head of the pattern to the base.
Inflation worries might be causing concern that the governments will be increasing interest rates to tackle which would obviously mean that the markets would react negatively.
Would only buy on the break of the base with a retest that confirms the structure.

BTC, AEX, GOLD AND MOEXThis is a asset combo that may predict the future.
I think Gold wil stop before ATH and fall of a cliff or there wil come a time of a Gold and Oil war.
The AEX is for me the second best profromer in the space and may bound on bad news but also could follow the MOEX and US down
BTC i think has and will disconnect form the FUD and sky rocket to new ATH with GOLD. if the Gold and Oil war Happen.
BTC UP Maybe longer sideway then gold
GOLD UP or sideways and down
AEX down or Sideways
MOEX down and then up with gold


A clear break below €755 could trigger a fall to €718A clear break below €755 could trigger a fall to €718, what happens next will be strongly related to the US markets and if they will show some recovery or a further downtrend later today.

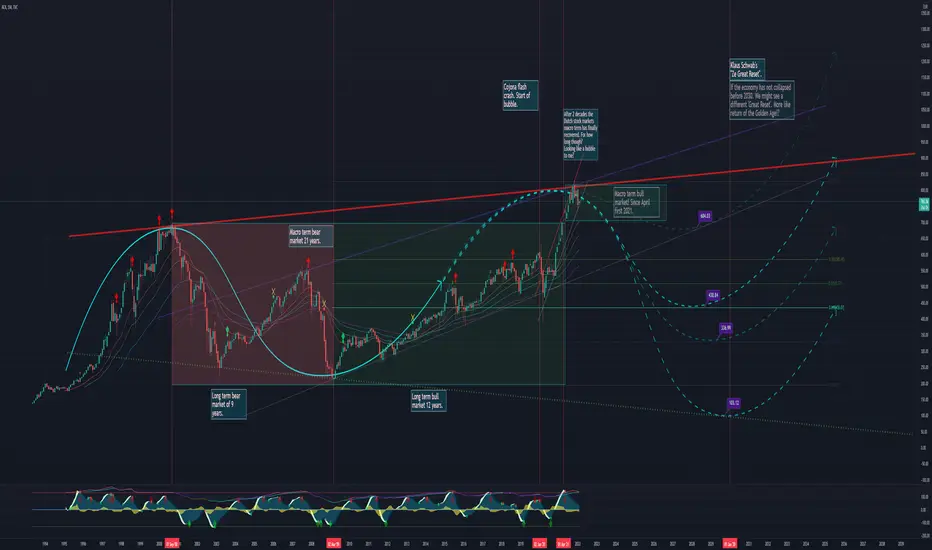
AEX index macro term analysisDeze doe ik het Nederlands, aangezien Nederlanders dit onderwerp direct treffen. Here we go, braise yourself.
Vermoedelijk hebben we zojuist de eerste helft van de huidige markt cycli bereikt. Op lange termijn gezien was dit een 12 jaar langdurige bull market. Daarvoor een 9 jaar bear market. Marcro termijn gesproken zijn we sinds April 2021 eindelijk weer hersteld van de 21 jaar lang durende bear market. Helaas heeft een bubbel dit mede veroorzaakt… Waar zijn we zeker van? Er is niets wat voor altijd omhoog gaat in de markten noch omlaag. Ongeacht, een bubbel barst altijd.
Na de corona “flash crash” ontstond er namelijk een bubbel. Dit is inmiddels gebarsten. Zie ‘wall-st. cheat sheet’ om te zien waar we zijn. Het is verbazingwekkend opmerkelijk. Dat alles erop wijst, wat er gaat gebeuren voor 2030… ‘Ze Great Reset’?
Ik zie 2 mogelijk gebeurtenissen. “The Great Reset” of “The return of a golden age”. Als we worst case scenario bereiken zonder dat de economie uiteenvalt. Dan gaan we waarschijnlijk een nieuw “gouden eeuw tegemoet”. Dan vormt er namelijk een super grote broadening wedge. Wat een consoliderende trend heeft maar niettemin een hoge kans voor een bullish break out. Als de economie uiteenvalt voor die tijd. Dan is er nog maar 1 keuze… The Great Reset, “where you will own nothing and be happy”…
Als dit daadwerkelijk de top is, dan is dit het begin van een bear market. Mijn inschatting is dat dit ongeveer 9 jaar gaat duren. Zeker tot 2030… Mijn advies? Financieel gezien overbodig, want jullie weten al wat er gaat gebeuren. Mijn tip, ga gauw cryptocurrency grondig onderzoeken. Mijn voorkeuren: Hex, PulseChain(eth 2.0) en PulseX(uniswap 2.0). Laatste 2 zijn nog niet uit! PulseX opoffer fase is nog steeds mogelijk! Wacht sowieso tot dat crypto markten(btc/eth/nft) een bodem hebben bereikt voordat je gaat inkopen. Beetje bij beetje lang houdbaar eten(eten in blik etc.) en drinken inslaan(vooral dit). Aangezien dit behoorlijk qua prijzen zullen gaan stijgen. Terwijl uw salarissen hetzelfde blijven.
Ik wens jullie veel geluk. Helaas kan ik niet iedereen redden. Na 10 jaar Technische Analyse, weet ik inmiddels dat de mainstream media steevast te laat is. Ofwel, "spread the word", wordt enorm gewaardeerd.
AEX Head & ShouldersLooking at the chart we can see quite an obvious head & shoulders pattern on the daily timeframe.
If we break the neckline the technical target will be around 690.
I also will be expecting a bounce in the 690 area.

AEX head and shouldersHead and shoulders pattern on the daily timeframe of the AEX index. Be cautious.

NL 25/ NETHERLANDS 25 POSSIBLE LONGAs indicated on the chart the recent high and the recent low, we can simply see that the market has touched the support level and now were looking to go and test the market's high for the second time around. Also as I've indicated that the market has the potential to go bullish due to the inverse head and shoulders pattern shown above. please let me know what you guys think and give me a like and a follow if you like how I do my analysis so you can see more of my work. Thank you in advance.

AEX ready for a trendline breakIt has been a party for the Dutch AEX for a while. However, the first signs of trend reversal are visible.
- Bearish divergence for a quite some weeks
- Shooting star candle (which is a candle pointing to trend reversal) as bounce from the bottom trendline which is contrary to the strong previous bounce back of the bottom trend line
It is an early call since the weekly isn't closed yet, but early signaling prevents people from being too late to act.
I've plotted the fibonacci retracement lines to choose your targets.

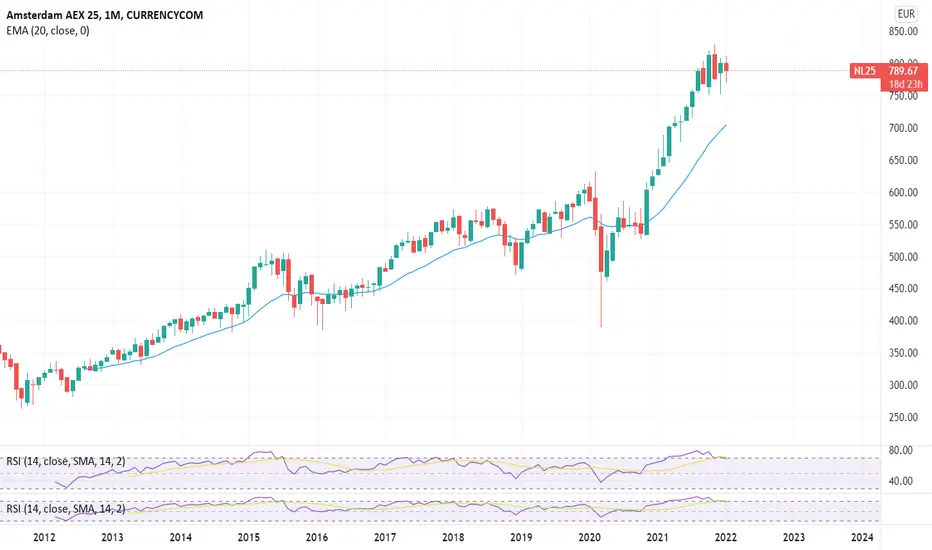
NL25 Bull Market Main trend up! And a double bottom formation confirming… Never go against the main trend

AEX: 1-, 5-, 21-day chartThe only value of these sort of models is in focus on market movement. Best compared to a float, the movement of the float triggers the response of the fisher. It doesn't say anything about underlaying market conditions, trends or motivators. (imho just speculation).
Cheers


NETHERLAND25 bearish scenario:The technical figure Pennant can be found in the major Dutch index AEX (NETHERLAND25) at daily chart. The AEX index, derived from Amsterdam Exchange index, is a stock market index composed of Dutch companies that trade on Euronext Amsterdam, formerly known as the Amsterdam Stock Exchange. Started in 1983, the index is composed of a maximum of 25 of the most frequently traded securities on the exchange. It is one of the main national indices of the stock exchange group Euronext. The Pennant has broken through the support line on 09/11/2021, if the price holds below this level you can have a possible bearish price movement with a forecast for the next 6 days towards 798.47 EUR. Your stop loss order according to experts should be placed at 824.63 EUR if you decide to enter this position.
Risk Disclosure: Trading Foreign Exchange (Forex) and Contracts of Difference (CFD's) carries a high level of risk. By registering and signing up, any client affirms their understanding of their own personal accountability for all transactions performed within their account and recognizes the risks associated with trading on such markets and on such sites. Furthermore, one understands that the company carries zero influence over transactions, markets, and trading signals, therefore, cannot be held liable nor guarantee any profits or losses.

Signal - Neth 25 - 1 Novemeber 21 - SellI used 1H to analyse this pair
* Price formed an ascending channel before breaking out to test the previous HL
* Price went up to test the above high however failed to break the high
* Hanging man candlestick is issued showing exhaustion of rising momentum
* Price broke the previous HL forming a new LL
Based on the above being ticked I am happy to sell this pair
