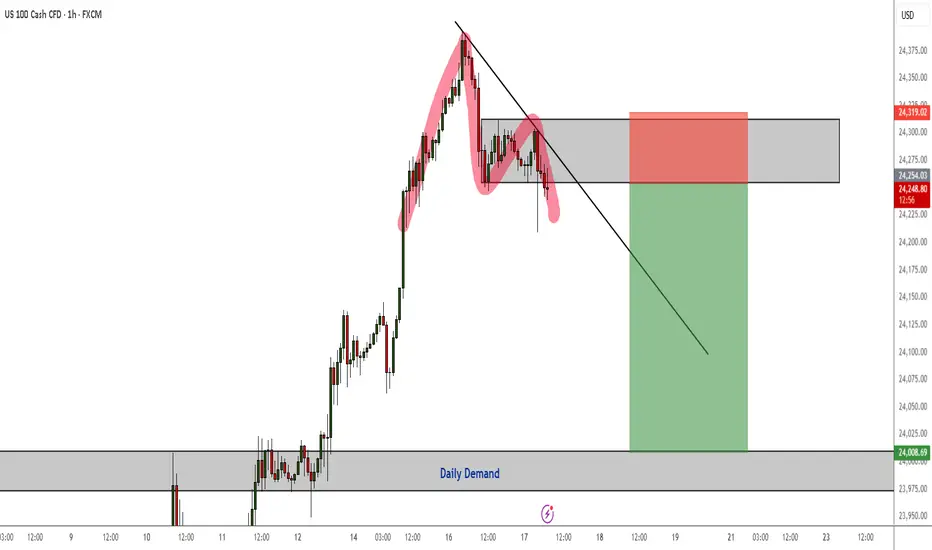
NAS100 Pressure to the Downside Continues - Double Top RejectionPressure to the downside will likely resume today for NQ as we now have a double top rejection pattern as confirmation to short.
I am aiming for the daily demand zone for my TP.
US100 trade ideas
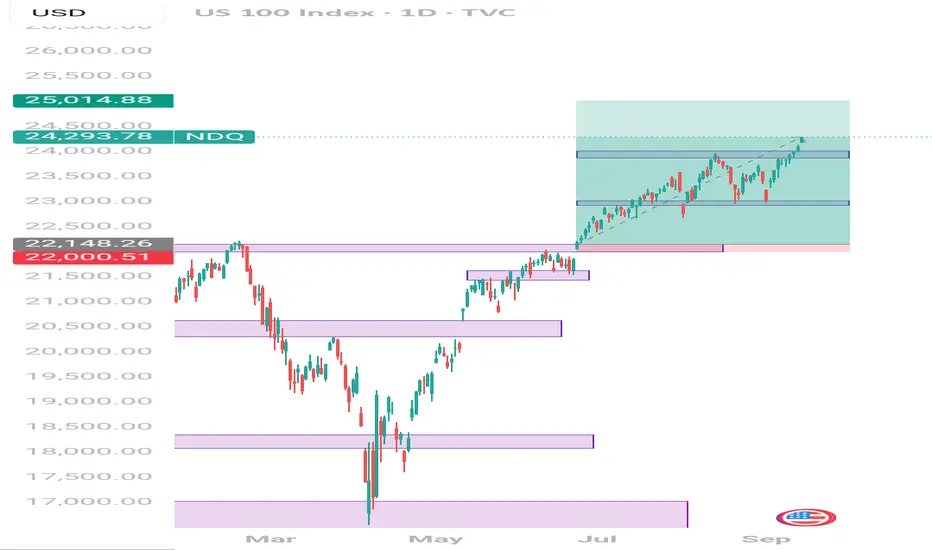
Nasdaq long position Nasdaq headed for $25,000. Recently Nasdaq surpassed my target of $24,000 and seems like the bullish momentum won't be stopping anytime soon. I have optimism of Nasdaq reaching $26,000 before the year ends.
NAS100 - New ATH in Overbought TerritoryDear Friends in Trading,
Overbought - Rising Wedge - Divergence - Be Careful
4HR + 12Hr only touching RSI 70% at this time.
NASDAQ printing new ATH's on Rate Cut Bets
Let me know if anything is unclear.
I sincerely hope my point of view offers a valued insight.
Thank you for taking the time study my analysis.
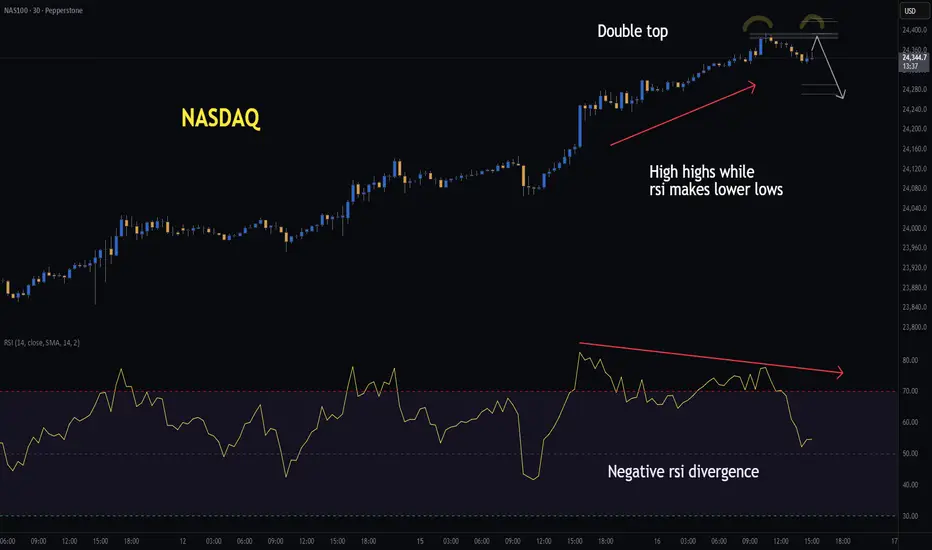
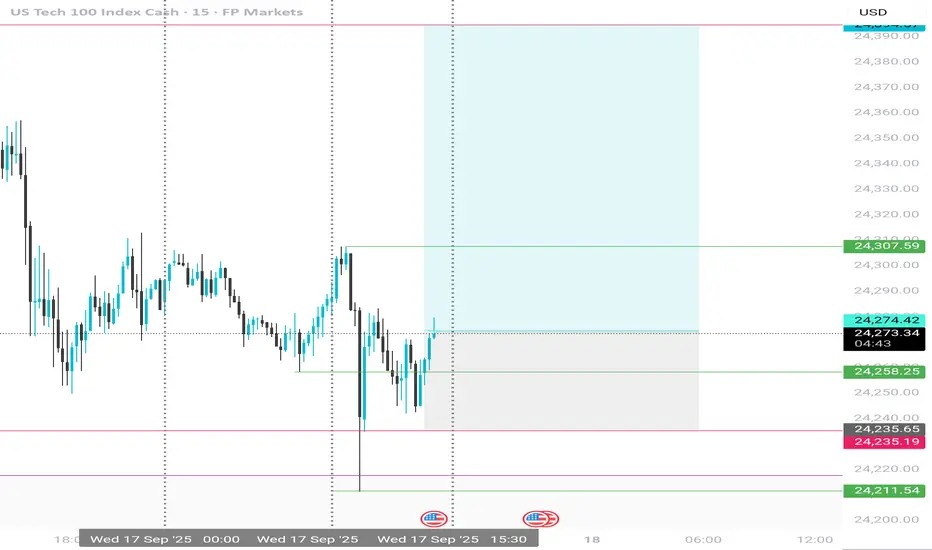
NASDAQ | H1 Double Top | GTradingMethodHello Traders,
I’m watching the Cash100 for a potential double top that could set up a short opportunity. Price is currently making higher highs while RSI is making lower lows — a clear sign of weakening buying momentum, also known as negative RSI divergence.
As further confluence, we have the FOMC tomorrow, and markets often prefer to de-risk ahead of such events. Also, there is a rising wedge on the S&P500 on the hourly chart and the chance that there is also a potential double top on the 30min timeframe.
✅ Conditions before entry:
- 30min candle must close within the range and at the correct level
- The closing candle must meet my required closure rate
- Ideally, volume should be lower (though I’ll allow an exception given it will be the U.S open)
- RSI should confirm with another divergence
📊 Trade Plan:
Risk/Reward: 2.9
Entry: 24,385.1
Stop Loss: 24,418.6
Take Profit 1 (50%): 24,290
Take Profit 2 (50%): 24,271
💡 GTradingMethod Tip:
Patterns like double tops are powerful, but they’re strongest when combined with momentum divergence. Always confirm multiple factors before entering.
🙏 Thanks for checking out my post!
Follow me for the next update and feel free to share your thoughts below — I’d love to hear them.
📌 Please note: This is not financial advice. This content is to track my trading journey and for educational purposes only.
NAS100Success in forex and stocks comes from a combination of knowledge, discipline, and patience. Understanding market trends, economic factors, and company fundamentals is crucial, but equally important is controlling emotions and sticking to a well-planned strategy. Continuous learning, adapting to changing conditions, and managing risk wisely can turn opportunities into consistent growth over time. Consistency, not luck, separates successful traders from the rest.

Waiting a complete swingShould this candle close successfully making a swing High, a rejection candle would confirm our setup, should we see a further bullish push higher than the high of this current 4Hours candle, we reconsider

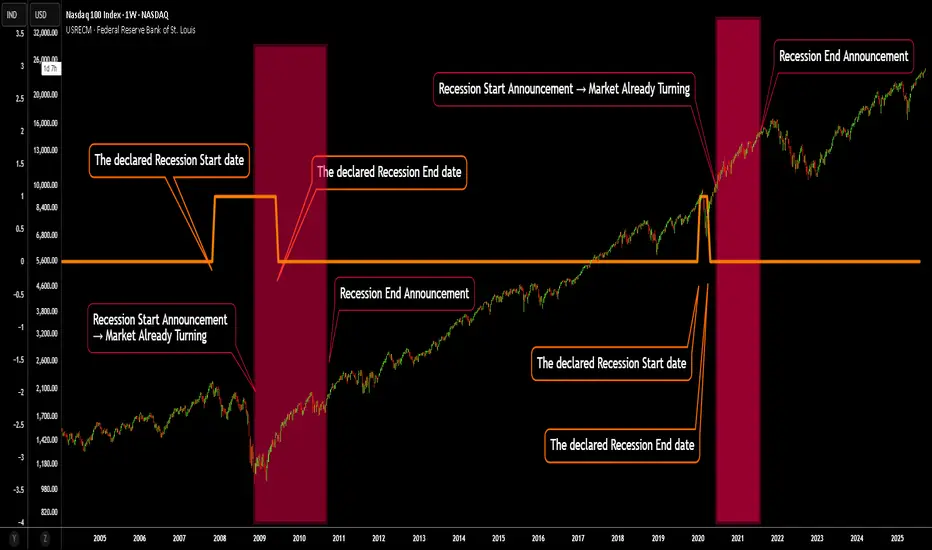
Recession “Announcements” vs. Reality — A Contrarian SignalMost traders anchor their sentiment to the official declarations of a recession. But here’s the catch: by the time policymakers and institutions announce “we are in a recession”, the contraction has almost always run its course.
If you are waiting for an official announcement we are in a recession in order to get out, It will be too late. You will likely be selling to the smart money buying for the eventual rise.
The game is rigged against the novice trader relying on generally available news.
On the chart:
The orange line marks the actual recession periods identified by economic data.
The red background shading highlights when the recession was officially recognized and reported.
Notice the lag: announcements consistently come after the worst is already behind us. Historically, these “recognition windows” line up closer with market bottoms than with tops.
👉 The key takeaway:
When you hear that a recession has been declared, it’s often not a sell signal — it’s closer to a buy signal. By then, the market has already priced in the pain, and recovery is underway.
This perspective flips conventional wisdom on its head: don’t fear the announcement — see it as confirmation that the worst is behind us. And do not wait for it to tell you we are going in to a recession, look at what the smart money is doing, what insiders are doing, what the banks are doing. Many thin that lower interest rates means a boost to business. But they are wrong.
Banks will charge as much as they think the economy can sustain. If Interest rates are rising, they know that business will be doing better. Falling interest rates tells you the banks know they can not get away with charging more and the economy is tanking.
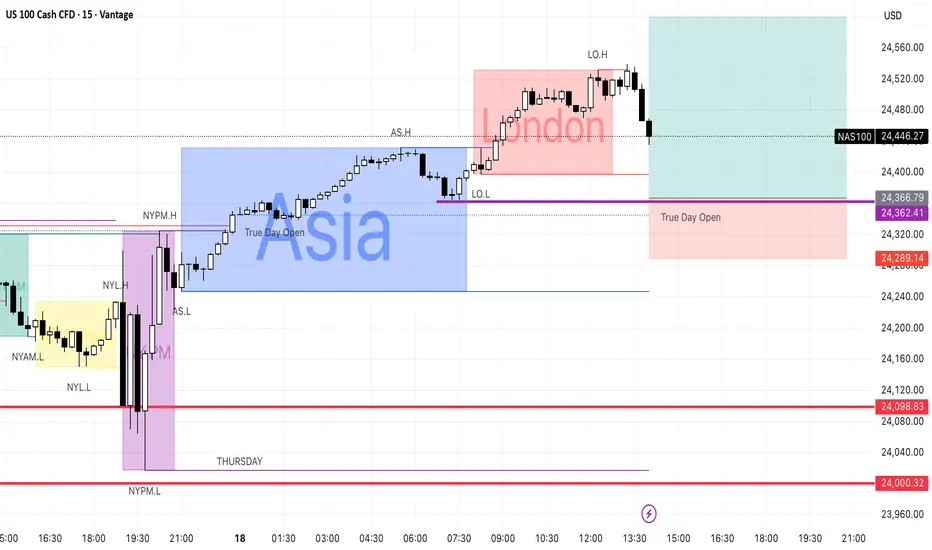
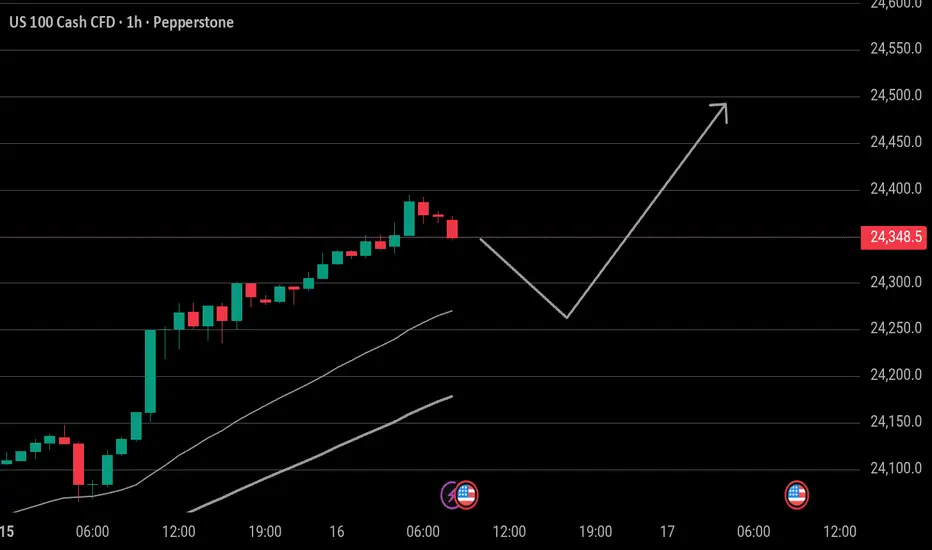
Direction bias on Nas100I'm bullish on nas100 and to continue the bullish run I'm expecting a pull back to sweet the inducement liquidity low then continue to the upside.

Nas100 Trade Set Up Sep 18 2025www.tradingview.com
price swept PDH and changed state on the 1h and created a 15m FVG so i want to see a retest of the CISD or 15m FVG, respect them to see bearish structure to the downside towards PDL but if price inverts 15m FVG i will look for buys

sweep London lows and up we go !!I believe price will sweep liquidity at the London low the I believe price will head back up past the todays London highs.

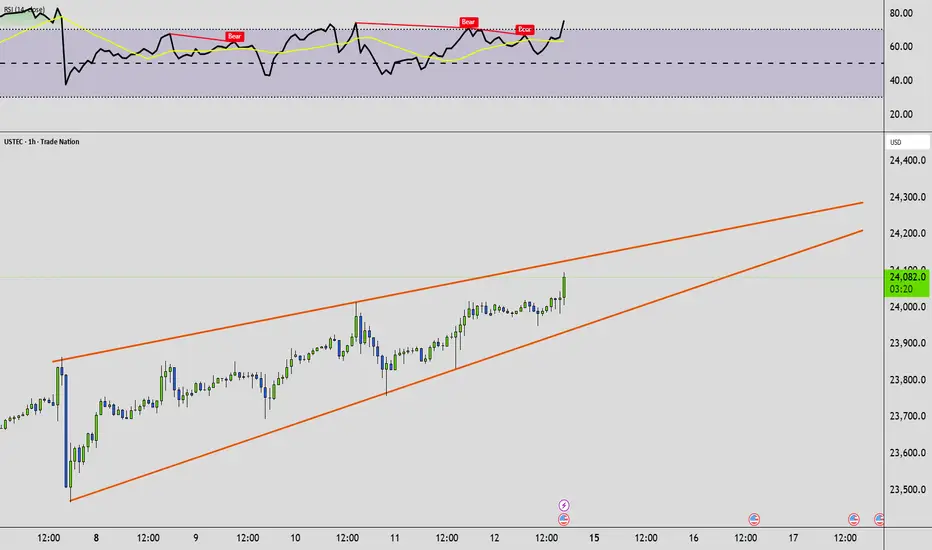
PullbackThe price is at the channel resistance and we have some good hourly divergences on RSI and MACD. Some pullback may start today. Retest of the green trendline at some point makes sense, but it may be too early for this, it can bounce and go higher from previous peaks.

Central bank week ahead!Central bank week ahead! We've got interest rate decisions out from the Bank of Canada, FED, Bank of England and Bank of Japan.
BoC 17/09 - 25bps cut 94% - First on the chopping board is the BoC who are set to reduce interest rates by 0.25%. This comes amid steady inflation, holding below the 2% target and below recent expectations for an increase, currently at 1.9%. They've also seen unemployment rising to 7.1%, the highest level since 2021. The BoC has acknowledged the weakening labour market but are expected to follow a wait and see approach after todays cut. Current rates 2.75%
FED 17/09 - 25bps cut 98% - The FED's first rate decision after some very rocky labour market data and a surprise dovish tilt from Powell at Jackson Hole. Inflation remains sticky but the FED has stated that their current focus is set on labour market weakness. As well as the rates, we will also receive updated economic and interest rate projections, likely to carry much more weighting and longer term direction. In the economic projections we'll be looking out for the dot plot, GDP, employment and inflation to gauge future expectations for FED rates. This could undermine or support the rate cuts to trade with caution. Current rates 4.25-4.50%
BoE 18/09 - HOLD 100% - The BoE is set to hold rates steady at 4.00% amid elevated inflation data and recently positive labour market data. Inflation data came in lower than consensus earlier this week but still remains well above target at 3.8%. In the previous BoE meeting we saw a surprise hawkish tilt in the way of MPC voting.
2 members shifted from voting to cut to voting for a hold and the scales are expected to remain fairly heavy on the hold side tomorrow. The member voting and minutes will provide much needed context to the potential hold to come. Current rates 4.00%
BoJ 19/09 - HOLD 87% - Rounding a busy week off with the BoJ who is set to hold rates at 0.50%. There has been some hawkish comments from the BoJ in recent times as inflation holds around 3.1% and unemployment recovers from 2.5% to 2.3% but amid political turbulence a bold move from the BoJ in this decision is less likely. However the other potential would be for a surprise rate hike with a current probability of 11%. The BoJ is no stranger to surprises so will be looking out for any action or comments made to support future JPY strength or weakness. Current rates 0.50%
These fresh rates provide the opportunity for divergences between monetary policy. This could park the continuation higher for pairs such as EURUSD and GBPUSD if the fed sticks to a more dovish tilt and supports this in their economic projections.
Other currency pairs such as AUDCAD and AUDNZD provide some clear divergence with the RBA holding higher rates and the BoC and RBNZ cutting with lower rates. Any clear pullbacks within these assets could provide opportunity to get long and hold through for a bigger move


NAS100USD (SHORT)
Trendlines show resistance and price has rejected at Zone
Also Major Pivots Resistance Zone

NasdaqNasdaq continued to renew highs overnight. This overbought region is likely to trigger a pullback with profit-taking to the 24250 range. Today we'll see the Retail Sails economic data, which could be favorable for the technology sector and lead to 24500.
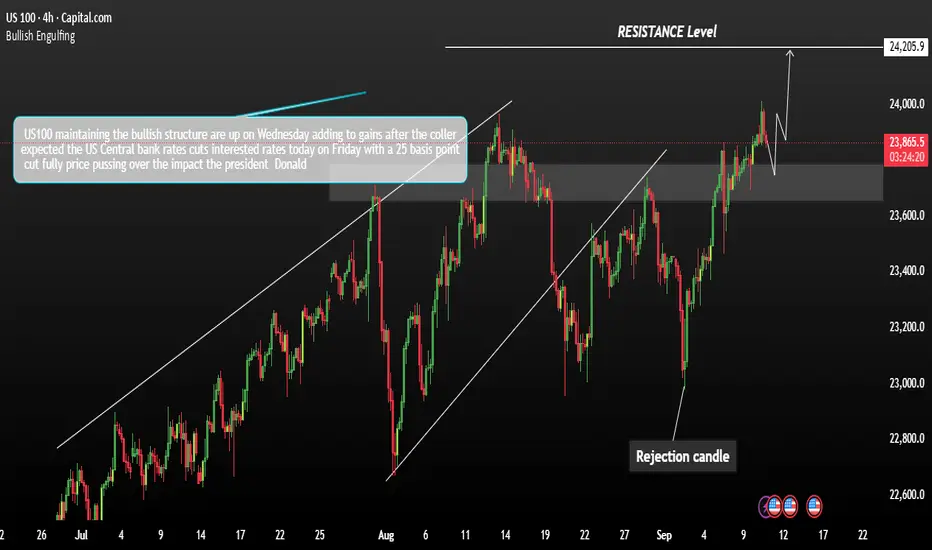
USNASDEQ 100 Futures are Price consolidation High Top US100 futures are higher on Wednesday, extending gains after a cooler-than-expected US Producer Price Index (PPI) report. The data eased inflation concerns, supporting risk sentiment. Oracle (ORCL) shares are surging, up more than 30% in pre-market trading following strong earnings and upbeat guidance.
The index remains bullish in structure. Price is expected to test the support area near 23,200. As long as the index holds above this level, momentum favours a move higher toward 24,200 in the next leg up.
You may find more details in the chart.
Trade wisely best of Luck.
Ps; Support with like and comments for better analysis Thanks for Support.
NAS100 HL's to HH's...Guaranteed 1While the market continues to make HL's to HH's...I am particularly cautious to enter new buys especially since we are currently trading at HH's and one of the first rules in trading is that you buy low and sell high.
With that in mind, I have given you a history of the market movements that landed us at multiple guaranteed HH's over the past week.
1. Everything looks normal until you got to Thursday's inflation data (indicated by the red dotted areas)
2. That wick still does not sit well with me and In my heart I still believe that we will see a revisit to that point and below before creating the next HL on the on the daily or weekly timeframes.
3. I am also cognizant of the fact that the daily timeframe has made a series of 3 HH's in July, August and currently in September which should not be ignored as this could be the perfect triple top setup for another retracement.
4. Since I have already booked my profits from one of the HH points from last week...there is absolutely no harm in waiting at this point for the market to reveal it's intentions for this week...Mondays, Tuesdays and sometimes Wednesdays are days the market consolidates, retraces and creates volatility before making a major move so patience will be key.
Finally if the trend is HL's to HH's and buyers have gotten their fair share of HH's, it would be silly not to wait for the next HL on the largest timeframe before committing to the next swing trade.
Please note that this is in no way a recommendation to blindly sell the market as you need to monitor your levels closely so you do not get trapped as the bears always do.
The only sure strategy in this scenario is to book your profits on the HH and wait for the next largest HL before buying again.
Have a great week.
HL's to HH's #guaranteed
#oneauberstrategy
#aubernation

USNAS100 Holds Below 24,115 as Fed Rate Decision LoomsUSNAS100 – Overview
Markets are awaiting the upcoming Federal Reserve rate decision, which will set the tone for the next move:
A 50 bps cut would likely trigger strong bullish momentum.
A 25 bps cut may result in a more moderate reaction.
📉 Bearish scenario: For now, the Nasdaq shows bearish momentum while trading below 24,115, with downside targets at 23,935 → 23,870 → 23,700.
📈 Bullish scenario: A confirmed 1H close above 24,115 would shift bias bullish, opening the way to 24,245 → 24,350.
Key Levels
Pivot: 24,115
Resistance: 24,245 – 24,350
Support: 23,940 – 23,870 – 23,700

US 100 Index – Assessing a Crucial Week for Tech StocksAs a trader it can be helpful to spend some time on a Sunday afternoon sitting at your trading desk gathering your thoughts and preparing for the week ahead. Checking the Pepperstone economic calendar to assess the scheduled risk events in terms of timing and importance can be a useful part of this process. This upcoming week is quite impressive, packed with central bank meetings and economic data that could impact many, if not all, of the major markets available to trade on the Pepperstone platform.
The standout event could be the Federal Reserve (Fed) interest rate announcement on Wednesday at 1900 BST, which is followed closely by the press conference led by Chairman Powell, which starts at 1930 BST. However, Thursday’s Bank of England interest rate decision at 1200 BST, or Friday’s Bank of Japan interest rate decision due at 0400 BST, and then the press conference led by Governor Ueda may also keep traders on volatility alert.
The US 100 index is the focus of today’s commentary as it can be more sensitive than other indices to interest rate moves made by the Fed.
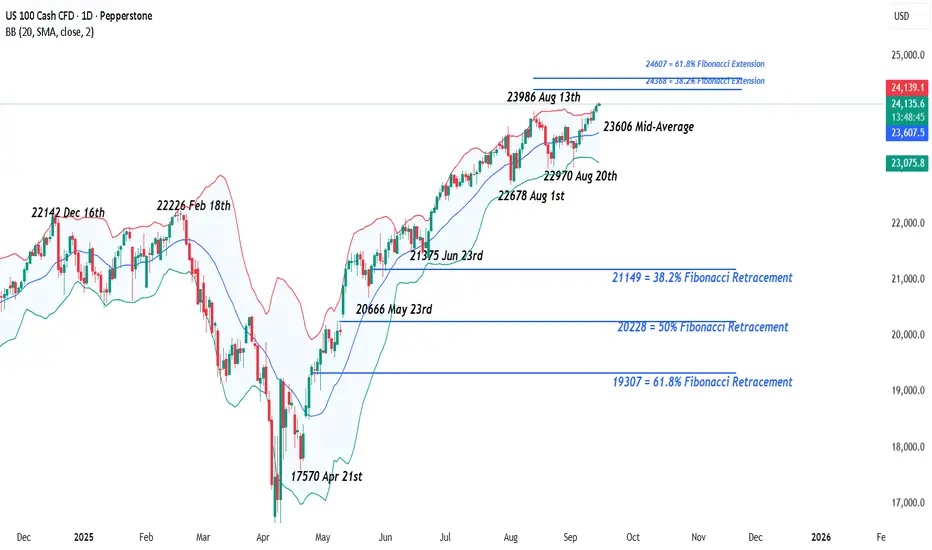
As can be seen on the daily Pepperstone chart above, the US 100 index has experienced a period of higher highs and higher lows since the 2025 low was hit way back at 16290 on April 7th, helped in no small part by a re-engagement of traders with the potential of artificial intelligence and what it could mean for the future earnings of the leading companies in this space. This AI driver is still in very much in play but may take a backseat this week due to the Federal Reserve rate decision.
Since the surprise weaker than expected US employment report on August 1st (Non-farm payrolls) market expectations for Fed rate cuts have increased, helping to support the latest US 100 uptrend from its August 1st lows at 22678 to print numerous record closing highs, the latest being Friday at 24096.
For the Fed interest rate decision on Wednesday, a 25bps (0.25%) cut is fully priced by traders, but there is a small outside chance of a 50bps (0.5%) cut, a decision which, if it happened, could generate equal amounts of uncertainty that policy makers feel they could be behind the curve in supporting the economy and that the labour market is weakening faster than anticipated, but also surprise that the Fed may be willing to cut rates faster, which as a general rule can be supportive of US100 index gains.
The press conference may also be a relevant consideration for US 100 price volatility. Traders will be keen to hear Chairman Powell’s stance on the possibility for further rate cuts, with economists predicting just one more 25bps cut into the end of 2025, while the market is pricing another 2 25bps reductions. Any comments he makes on the independence of the US central bank, with an appeal court ruling expected imminently on whether President Trump has the authority to sack Fed Governor Cook, as well as his thoughts on the deterioration of the US labour markets and direction of inflation could also be important.
Technical Update: New All-Time Highs Posted
After reaching a new all-time high of 24142 on Friday, the market continues to show signs of a positive trend, which has been evident since the low of 16290 recorded on April 7th.
As the chart above shows, the market has formed a pattern of higher highs and higher lows. While this doesn’t guarantee that prices will continue to rise, the recent new peak suggests there might be further upward momentum ahead.
Although positive sentiment appears to remain in place, this week’s upcoming data releases and interest rate decision could significantly impact price movements.
As a result, it may be important to identify and then monitor key support and resistance levels in case an increased spell of volatility emerges.
Potential Resistance Levels:
Following the recording of the latest all-time high at 24142 on Friday, traders may be anticipating continued attempts at upward momentum to extend the current uptrend.
The outlook suggests that further attempts to push toward the next resistance levels could emerge in the coming week.
With the US 100 index now entering uncharted territory, traders may be turning their attention to Fibonacci extension levels based on the August 13th to 20th sell-off. The 38.2% extension is at 24368, and if this level is breached, the next potential resistance could be 24607, the 61.8% extension.
Potential Support Levels:
The US 100 recently closed back above the rising Bollinger mid-average, currently at 23606, and so this level could act as the first initial support for the week. If retested, it may be important to monitor whether the market can hold above it on a closing basis.
A closing break below 23606 wouldn’t necessarily signal a negative shift, but it could open the door for a test of 22970, which is the low from August 20th, and potentially lower if that level fails to hold.
The material provided here has not been prepared accordance with legal requirements designed to promote the independence of investment research and as such is considered to be a marketing communication. Whilst it is not subject to any prohibition on dealing ahead of the dissemination of investment research, we will not seek to take any advantage before providing it to our clients.
Pepperstone doesn’t represent that the material provided here is accurate, current or complete, and therefore shouldn’t be relied upon as such. The information, whether from a third party or not, isn’t to be considered as a recommendation; or an offer to buy or sell; or the solicitation of an offer to buy or sell any security, financial product or instrument; or to participate in any particular trading strategy. It does not take into account readers’ financial situation or investment objectives. We advise any readers of this content to seek their own advice. Without the approval of Pepperstone, reproduction or redistribution of this information isn’t permitted.
NAS100 - Stock market awaits Federal Reserve meeting!The indicator is above the EMA200 and EMA50 on the one-hour timeframe and is in its long-term ascending channel. If the drawn upward trajectory is maintained, I can expect the future to continue as it has in the past. In case of a valid breakdown, its downward path is to the specified range, which can be approached with a reward for buying.
Last week’s economic data painted a mixed picture of the U.S. economy. On the one hand, new jobless claims rose to 263,000, above the market forecast of 235,000, signaling labor market weakness. On the other hand, the August inflation report came in hotter than expected, though most of the increase stemmed from housing costs rather than tariff pressures. Rents rose 0.34%, marking the fastest gain since December 2024, while shelter costs climbed 0.39%, the sharpest jump since January 2025. Still, real-time housing indicators suggest that prices are adjusting, which will likely be reflected in official data in the coming months.
Meanwhile, the yield on the U.S. 10-year Treasury fell below 4% for the first time since April—a sign that markets are reacting more to labor market weakness and the prospect of Fed rate cuts than to inflation concerns.
CIBC, analyzing the August Consumer Price Index (CPI) report, stated that while the data came in slightly above expectations, it was not strong enough to dissuade the Federal Open Market Committee (FOMC) from delivering a 25-basis-point cut next week. Ali Jafari, an economist at the bank, wrote: “There was little in the report to prevent a September rate cut. More importantly, the labor market needs support, and a weaker jobs market implies softer demand-side inflationary pressures ahead.”
On a yearly basis, core inflation held steady at 3.1%, while headline inflation rose two-tenths to 2.9%, both in line with forecasts. More troubling, however, are signs that price increases are spreading into new sectors. The report noted: “Tariff pass-through effects intensified this month, with core goods prices rising at the fastest pace since broad tariffs were imposed. Today’s report also showed the first notable increase in new car prices, suggesting that tariff impacts may now be extending to higher-ticket items, though overall car price gains remain modest.”
CIBC expects the Fed to cut rates in September and October, pause afterward, and then deliver two additional cuts in the first half of next year. The bank added: “The overall U.S. inflation picture remains notably above target, but the Fed is willing to tolerate this for now, given growing concerns about a weakening economy and a labor market showing signs of fatigue.”
Separately, U.S. President Donald Trump once again criticized the Fed in an interview with Fox News, saying the central bank “always acts late on interest rates.” He added: “We have the best stock market in history. Inflation has come down, equities are climbing, so rates should be lower.”
These comments come as the Fed is widely expected to cut rates at Wednesday’s meeting. While such a move could reduce borrowing costs in the short term, analysts caution that lower short-term rates do not necessarily translate into lower long-term yields.
Morgan Stanley now projects that the Fed will cut rates by 25 basis points at each of the three remaining meetings this year—an upgrade from earlier forecasts of only September and December cuts. The bank also expects three additional 25-basis-point cuts in January, April, and July of 2026.
At the same time, Standard Chartered has revised its outlook and now anticipates a 50-basis-point cut in September—double its previous forecast. The shift followed weak August jobs data showing employment growth had slowed sharply and unemployment rose to 4.3%, the highest since late 2020. The bank described labor market conditions as “dramatic,” noting that in just six weeks the market shifted from “strong” to “weak.” It characterized the larger cut as a form of “catch-up” to align monetary policy with economic realities.
This week is set to be pivotal for global markets, with a series of central bank decisions and key economic releases. Monday will see the Empire State manufacturing index, followed by Tuesday’s August retail sales report. On Wednesday, housing starts and building permits will be released, along with the Bank of Canada’s rate decision. The highlight of the week, however, will be the Fed meeting and Jerome Powell’s press conference.
On Thursday, the Bank of England will announce its policy decision, followed by U.S. jobless claims and the Philadelphia Fed manufacturing survey. The busy week will conclude Friday with the Bank of Japan’s policy announcement.

Nasdaq longLooking for longs again .
Asian lows have been swept.
Manipulation amd reversal to the upside.
NAS100 Sideways Market | Key Resistance Rejection Ahead?The NAS100 index is currently trading within a sideways market structure, holding between 23,000 support and 24,000 resistance.
Recent rejection at resistance shows sellers defending the upper range.
CHoCH and BOS patterns confirm short-term structure shifts.
If price fails to break and sustain above 24,000, a move back towards the 23,400–23,200 demand zone is possible.
Only a clear breakout above 24,000 would shift bias to bullish continuation.
This setup highlights a range-bound market where patience is key—watch for confirmation before positioning.
This analysis is for educational purposes only and does not constitute financial advice. Trade at your own risk.
