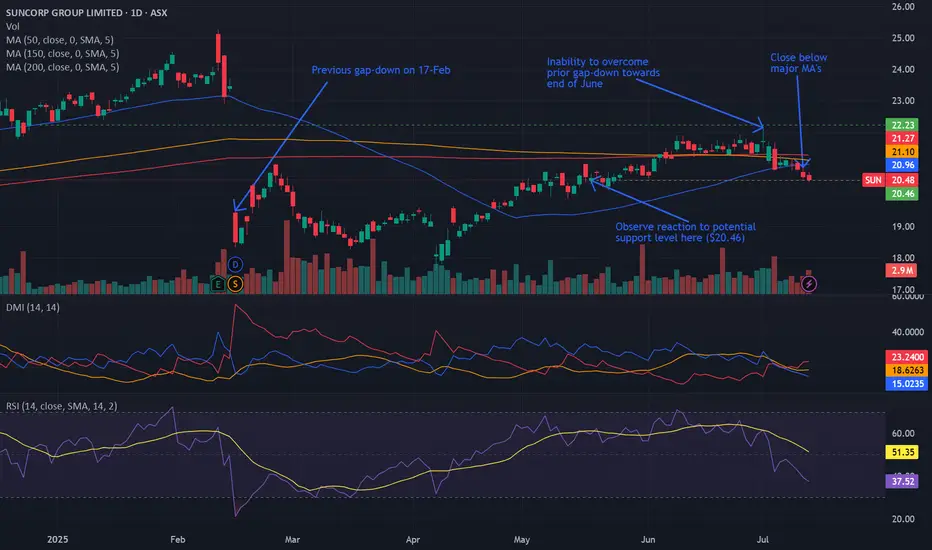
Bearish potential detected for SUNEntry conditions:
(i) lower share price for ASX:SUN along with swing of DMI indicator towards bearishness and RSI downwards, and
(ii) observing market reaction around the share price of $20.46 (open of 19th May).
Stop loss for the trade would be:
(i) above the potential prior resistance of $21.36
Suncorp Group Ltd
No trades
Next report date
—
Report period
—
EPS estimate
—
Revenue estimate
—
0.92 USD
997.55 M USD
11.08 B USD
1.08 B
About Suncorp Group Limited
Sector
Industry
CEO
Steve Johnston
Website
Headquarters
Brisbane
Founded
2010
IPO date
Jul 7, 1988
Identifiers
2
ISIN AU000000SUN6
Suncorp Group Ltd. is a financial services company, which engages in the provision of banking, wealth, and insurance products and services. It operates through the following segments: Consumer Insurance, Commercial and Personal Injury, Suncorp New Zealand, and Corporate and Internal Reinsurance. The Consumer Insurance segment provides insurance products to customers in Australia including home and contents, motor, and boat. The Commercial and Personal Injury segment offers insurance products to customers in Australia including commercial motor, commercial property, marine, industrial special risks, public liability and professional indemnity, workers’ compensation and compulsory third party. The Suncorp New Zealand segment includes general and life insurance products to customers in New Zealand. The Corporate and Internal Reinsurance segment is involved in the business strategy activities and shared services. The company was founded in 1902 and is headquartered in Brisbane, Australia.
Related stocks
Buying small qty of SUN stop at 17.49SUN is doing well, looking to break though it's all time high. given the overall market action and this price action taking a small exposure to share with tight stop.

SUNSuncorp Group Limited is an Australian finance, insurance, and banking corporation based in Brisbane, Queensland, Australia.
Testing multi-month overhead supply. Volume + strong candle structure would be welcomed. Global insurers + re-insurers have been leaders (see some of the U.S & German operato

SUN - 6 months SYMMETRICAL TRIANGLE══════════════════════════════
Since 2014, my markets approach is to spot
trading opportunities based solely on the
development of
CLASSICAL CHART PATTERNS
🤝Let’s learn and grow together 🤝
══════════════════════════════
Hello Traders ✌
After a careful consideration I came to the conclusion that:
-


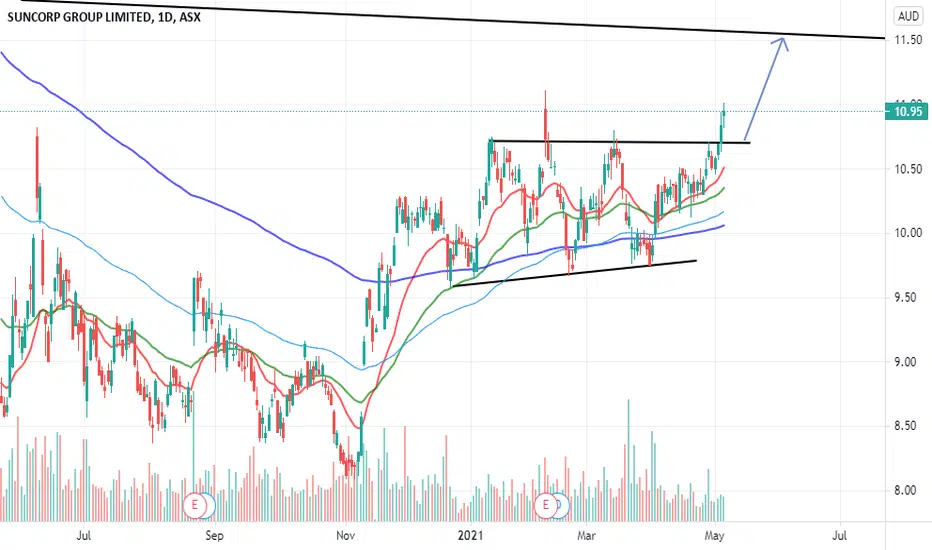
SUN - Bullish Trade PlanAfter making a Higher High SUN had retraced lower to Support of $9.60, and have bounced off quite well. Price is above the 200SMA and 50SMA, indicating that its bullish. I think SUN should continue higher with targets as below:
TP1 - 10.70 (potential gain 4%)
TP2 - 10.96 (potential gain 6.5)
Stoplo


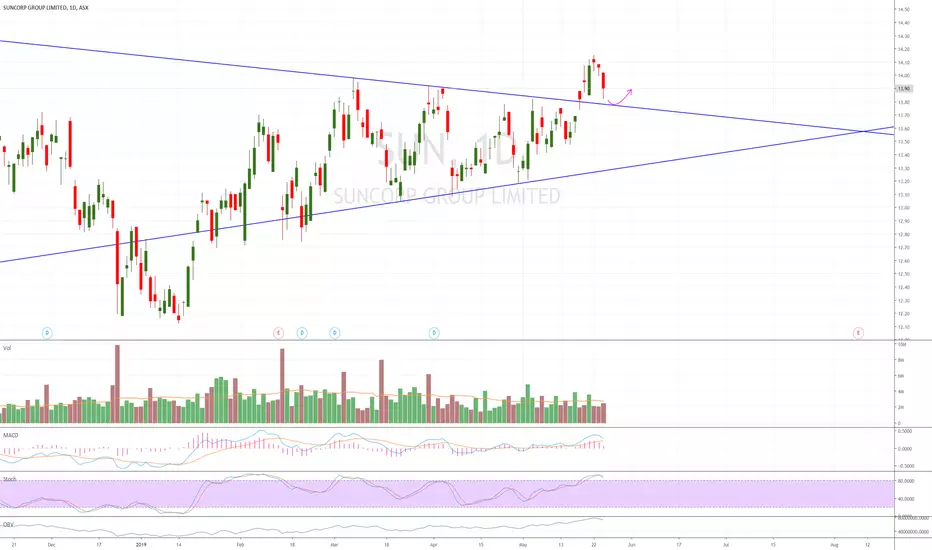
Possible short opportunity 2 x bearish divergence on RSI / MFI indicator 1 x on stochastic with likely 2nd , directional candles trending down

See all ideas
Summarizing what the indicators are suggesting.
Neutral
SellBuy
Strong sellStrong buy
Strong sellSellNeutralBuyStrong buy
Neutral
SellBuy
Strong sellStrong buy
Strong sellSellNeutralBuyStrong buy
Neutral
SellBuy
Strong sellStrong buy
Strong sellSellNeutralBuyStrong buy
An aggregate view of professional's ratings.
Neutral
SellBuy
Strong sellStrong buy
Strong sellSellNeutralBuyStrong buy
Neutral
SellBuy
Strong sellStrong buy
Strong sellSellNeutralBuyStrong buy
Neutral
SellBuy
Strong sellStrong buy
Strong sellSellNeutralBuyStrong buy
Displays a symbol's price movements over previous years to identify recurring trends.
Frequently Asked Questions
The current price of SNMYF is 11.70 USD — it has increased by 0.04% in the past 24 hours. Watch Suncorp Group Ltd stock price performance more closely on the chart.
Depending on the exchange, the stock ticker may vary. For instance, on OTC exchange Suncorp Group Ltd stocks are traded under the ticker SNMYF.
We've gathered analysts' opinions on Suncorp Group Ltd future price: according to them, SNMYF price has a max estimate of 15.10 USD and a min estimate of 12.51 USD. Watch SNMYF chart and read a more detailed Suncorp Group Ltd stock forecast: see what analysts think of Suncorp Group Ltd and suggest that you do with its stocks.
SNMYF reached its all-time high on Oct 12, 2007 with the price of 22.91 USD, and its all-time low was 3.31 USD and was reached on Mar 3, 2009. View more price dynamics on SNMYF chart.
See other stocks reaching their highest and lowest prices.
See other stocks reaching their highest and lowest prices.
SNMYF stock is 0.04% volatile and has beta coefficient of 0.38. Track Suncorp Group Ltd stock price on the chart and check out the list of the most volatile stocks — is Suncorp Group Ltd there?
Today Suncorp Group Ltd has the market capitalization of 12.22 B, it has increased by 2.33% over the last week.
Yes, you can track Suncorp Group Ltd financials in yearly and quarterly reports right on TradingView.
Suncorp Group Ltd is going to release the next earnings report on Feb 18, 2026. Keep track of upcoming events with our Earnings Calendar.
SNMYF earnings for the last half-year are 0.38 USD per share, whereas the estimation was 0.37 USD, resulting in a 2.05% surprise. The estimated earnings for the next half-year are 0.18 USD per share. See more details about Suncorp Group Ltd earnings.
Suncorp Group Ltd revenue for the last half-year amounts to 4.66 B USD, despite the estimated figure of 4.65 B USD. In the next half-year revenue is expected to reach 4.82 B USD.
SNMYF net income for the last half-year is 475.43 M USD, while the previous report showed 491.22 M USD of net income which accounts for −3.22% change. Track more Suncorp Group Ltd financial stats to get the full picture.
Suncorp Group Ltd dividend yield was 4.50% in 2025, and payout ratio reached 69.30%. The year before the numbers were 4.48% and 82.63% correspondingly. See high-dividend stocks and find more opportunities for your portfolio.
As of Feb 14, 2026, the company has 11.5 K employees. See our rating of the largest employees — is Suncorp Group Ltd on this list?
Like other stocks, SNMYF shares are traded on stock exchanges, e.g. Nasdaq, Nyse, Euronext, and the easiest way to buy them is through an online stock broker. To do this, you need to open an account and follow a broker's procedures, then start trading. You can trade Suncorp Group Ltd stock right from TradingView charts — choose your broker and connect to your account.
Investing in stocks requires a comprehensive research: you should carefully study all the available data, e.g. company's financials, related news, and its technical analysis. So Suncorp Group Ltd technincal analysis shows the sell today, and its 1 week rating is sell. Since market conditions are prone to changes, it's worth looking a bit further into the future — according to the 1 month rating Suncorp Group Ltd stock shows the sell signal. See more of Suncorp Group Ltd technicals for a more comprehensive analysis.
If you're still not sure, try looking for inspiration in our curated watchlists.
If you're still not sure, try looking for inspiration in our curated watchlists.