SOL to 172 targetHi, this is my new SOLANA target which is 172
Apparently SOL is extremely bullish lately and it's not stopping at all.
Currently already passed Fib 0.50 and at price 100. Next stop would be 130-140 and then to my target 172.
SOLUSDT.P trade ideas

SOL - range breakout with OI increse SOL - range breakout with OI increase
Test of 1st dev is a good place for long entry

SOL - Next Stop => $200Hello TradingView Family / Fellow Traders. This is Richard, also known as theSignalyst.
📈 SOL has been overall bullish trading within the long-term rising broadening wedge in blue.
How high can SOL climb?
The marked blue circle represents a significant resistance and overbought zone as it marks the intersection of the upper blue trendline and $200 round number.
Thus it would be a robust area to anticipate a potential reversal.
🏹 Meanwhile, as long as the $150 support holds, a continuation towards the $200 mark would be expected.
📚 Always follow your trading plan regarding entry, risk management, and trade management.
Good luck!
All Strategies Are Good; If Managed Properly!
~Richard Nasr

SOL USDT - SOLANA | 1H | TECHNICAL CHART Hello traders, BINANCE:SOLUSDT I have determined the formation target on the chart. I wish everyone success.
Like and comment if you find value in our analysis.
Feel free to post your ideas and questions at the comments section.
Wish you many pips
PS: Thank you very much that you support me with your likes and Comments
If you have another analysis at this pair, please share in comments, I will be glad to discuss with you.

SOL Near Supply Zone 1Sol Is Near Supply Zone
If Breakout SZ1 Raising To SZ2
Deman Zone (Blue Zone) It is strong in the weekly time

Solana is respecting market structureThe 140.00 level has been respected as a support and this token continues to create higher highs and higher lows which shows that the trend is healthy. A simple market structure analysis gives us a bullish forecast. Targets: 154.50 and 165.00

textbook for Solana = exactly ATHPersonally not really a fan of Solana.. hyped too much, but technically very strong.. only token that did it's own thing and going for a ATH whilst the rest was crashing..
Now we have a very wide and broad inverthed H&S, with quite a big head and some tiny shoulders, but if it plays out.. exactly the old ALL TIME HIGH of 250 USD...


SOL/USDT4H 13/03/2023Solana is currently encountering a significant resistance level at 155. However, considering the current bullish trend in the cryptocurrency market, it is highly likely that Solana will surpass this resistance level and continue its upward trajectory towards 171.
Following this breakthrough, it remains to be seen whether Solana's journey towards 220 will be smooth or if it will encounter substantial resistance along the way.

solana → melikatrader94 analysis hello guys...
as you can see, Solana made a range in a lower frame! so we can expect this coin will touch the 135 area!
on the other hand, this coin has an internal trendline and it can work as a support area!
let’s see what happens when the price will touch the 135$ area!
___________________________
✓✓✓ always do your research.
❒❒❒ If you have any questions, you can write them in the comments below, and I will answer them.
❤︎ ❤︎ ❤︎And please don't forget to support this idea with your likes and comment

Technicals Flag Bearish as SOL Gets Rejected by ResistanceIn the latest trading activity, the Solana price made a noteworthy attempt to breach the $155 resistance level. However, it encountered firm resistance, resulting in two distinct rejections from this critical threshold. Such a pattern, known as a double-tap rejection at resistance, often signals bearish sentiment, hinting at a potential downturn. Following these unsuccessful attempts to rally, SOL has retraced to find support at $148.98. This level now serves as a pivotal point for the asset; a breach below could precipitate a decline towards the $136.10 support level within the ensuing 48 hours. If the selling pressure persists beyond this point, SOL could see its value diminish further, possibly reaching down to $124.21. This scenario hinges on the ability of the bulls to mount a defense and prevent further losses.
Conversely, should Solana manage to secure a 4-hour candle close above the $155 resistance within the next day, it could invalidate the bearish outlook. Such a development would not only signal strength but also potentially lay the groundwork for continued upward momentum in the days that follow.
Technical Analysis and Market Sentiment
The bearish sentiment is further corroborated by technical indicators on the 4-hour chart, notably the Moving Average Convergence Divergence (MACD) and the Relative Strength Index (RSI). The MACD is teetering on the edge of a bearish crossover, with the MACD line poised to move below the signal line. This event could indicate the beginning of a short-term bearish phase for Solana. Additionally, the RSI showcases a diminishing strength of buyers relative to sellers, as it veers towards its Simple Moving Average (SMA) line. A crossover here is often interpreted as a bearish signal, suggesting that sellers are gaining the upper hand.
Trading Strategies: Short and Long Entries and Exits
Given this analysis, traders might consider the following strategies:
Short Entry: Should SOL break below the current support level of $148.98, it could serve as an entry point for a short position, with an initial target at the next support level of $136.10. Extending the target to $124.21 may be viable if the downward momentum continues.
Short Exit: To manage risk, consider setting a stop-loss slightly above the $148.98 level or the entry point to minimize potential losses should the market direction reverse unexpectedly.
Long Entry: A bullish scenario would be confirmed by a 4-hour candle closing above the $155 resistance level. Entering a long position following such a breakout could capitalize on the momentum, aiming for an initial profit target at higher resistance levels, potentially around the $165 mark, reflecting recent highs or significant psychological levels.
Long Exit: For long positions, setting a stop-loss below the entry point, possibly just under the $155 breakout level, would help protect against sudden downturns. Profit targets should be set according to individual risk tolerance and market analysis, possibly taking partial profits at predetermined levels while letting the remainder of the position ride with a trailing stop to maximize gains.
Traders should continuously monitor market conditions, as cryptocurrency markets are highly volatile and can shift rapidly. Adjusting strategies in response to fresh technical or fundamental signals is crucial for successful trading.

SOLANA!!!! Future OutlookSOLANA is showing signs of reversal with bearish weekly divergence. It already has made a cup pattern with potential downside is possible for completing the handle. Potential downside target based on fib level is between 82$ to 65$ at 50% to 60% respectively.
*******Trade Plan******
Take Entry @ Daily TF as soon as HL broke
Stop Loss @ Top
Take Profit 1 @ Fib 50%
Take Profit 2 @ Fib 60%
What do you think, will it create cup & handle?

SOLSolana is currently experiencing a bullish trend, but I have made the decision to trade against it, anticipating a necessary correction for sustainable growth.

🚧SOL is Bullish now🚧 & many Traders don't see it 👀!!!Hi.
COINEX:LTCUSDT
😊Today, I want to analyze SOLUSDT for you in a Weekly time frame so that we can have a Mid-term view of SOLUSDT regarding the technical analysis. (Please ✌️ respectfully ✌️share if you have a different opinion from me or other analysts).
SOL has Created a Large Rounded Bottom. This Means The Price Can Increase as Much as the Length Between The Top and The Bottom Of the Rounded Bottom. Since the rounded bottom is Not broken. The price can have a good rally after the breakout.
✅ Due to the Ascending structure of the chart...
- High potential areas are clear in the chart.
- Rounded Bottom
- AB=CD
Stay awesome my friends.
_ _ _ _ _ _ _ _ _ _ _ _ _ _ _ _ _ _ _ _ _ _ _ _ _ _ _ _ _ _ _ _ _
✅Thank you, and for more ideas, hit ❤️Like❤️ and 🌟Follow🌟!
⚠️Things can change...
The markets are always changing and even with all these signals, the market changes tend to be strong and fast!!

SOL Solana Potential Retracement SoonIf you haven`t sold the Head and Shoulders chart pattern on SOL:
Then using the Fibonacci Retracement tool, I believe there will be a new buy opportunity in the $120 - $127 range!

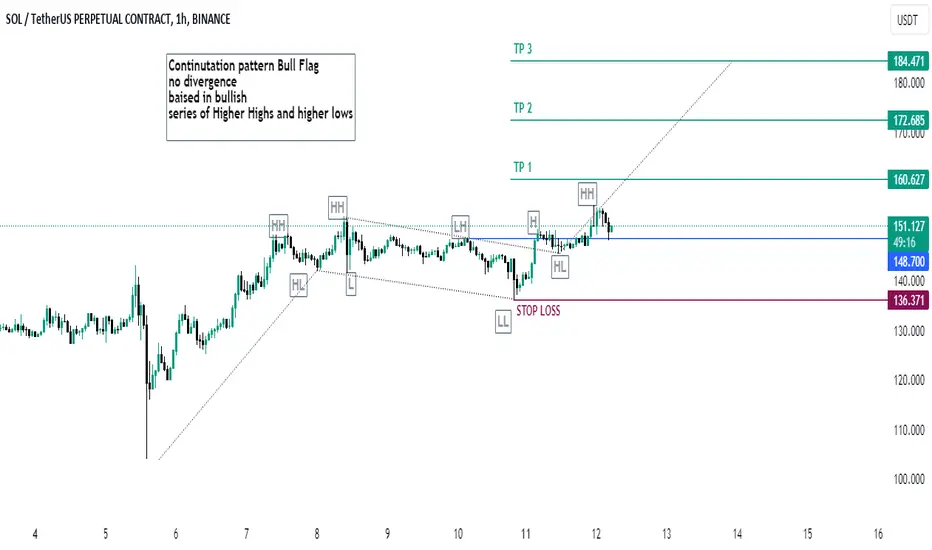
SOLUSDT.P LONG IDEAContinutation pattern Bull Flag
no divergence
baised in bullish
series of Higher Highs and higher lows

SOL longs looking good, More than 1RR trade with clear invalidatSOL is looking strong and aiming for $111 for 1st TP and will play it until #BITCOIN hits $55.5k.

SOL / USDT TREND PREDICITON 1HHello guys. It's my solana chart
MAYBE 136 - 140 $ zone buyers will come to the market so please becareful about your trades and DONOT ENTER WITHOUT CONFIRMATION
Levels shown for you.
If you have a question please comment it for me

SOL Solana Technical Analysis and Trade IdeaSolana (SOL) demonstrates a robust bullish trend, recently surpassing previous highs and clearing liquidity above a prior monthly high. A potential retracement to the 61.8 Fibonacci level could present a buying opportunity. Our targets are aligned with previous monthly highs, as illustrated in the video.
Disclaimer: This analysis offers a technical viewpoint and does not constitute direct financial advice. Trading in cryptocurrencies carries inherent risk. Always consult a qualified financial professional and carefully evaluate your individual risk tolerance before making investment decisions.

SOL SCALP 3/10/24 Target SetSOL long scalp target set. TPO the description is short because its very easy and clear to see :)

Welcome to the jungle #solana #sol This is not a sign of strenght, in my previous CRYPTOCAP:SOL ideas, i explained. I am not expecting deeper correction, the hype is strong.
NOT FINANCIAL ADVICE.

#SOL/USDT#SOL
The price was pushed strongly to achieve 6X and is currently correcting
There are two possibilities: either completing the ascent directly
Or fall to touch the trend at level 86 and complete the rise
First goal 113.41
Second goal 126.79
Third goal 138.37
Fourth goal 150.85
