Short Position On Solana!I made such setup for short position!
see in 1m TF,
Entry point: Below Buyside Price Line
TP: Monday Low
Wait for Market structure shift!
11:18
SOLUSDT trade ideas


Solana, May Short on NY Session!? (Scenario 3)May we have this form.
If Price in 1H TF, Cross the High of Previous Candle.
We may have such position to short!
Wed 19 Jun - 9:38

Support and potencial reversal strategyThe support level and double-bottom pattern provide a potential trading opportunity for SOL/USDT. Monitor the price action around the support level and use the outlined strategy to capitalize on a potential upward move
We see..

SOLUSDT.1DAnalyzing the SOL/USDT chart, we notice a few key technical elements that provide insights into the market's current dynamics and potential future movements.
Key Observations:
Current Price and Movement:
SOL/USDT is trading at $133.83, marking a decline of 1.32% today. This movement places SOL near an important support level.
Support and Resistance Levels:
R1 (Resistance Level 1): $193.09 - This level represents a significant barrier that SOL would need to overcome to confirm a bullish trend.
S1 (Support Level 1): $116.96 - Positioned as the first major support, holding above this could be crucial for maintaining a bullish outlook.
S2 (Support Level 2): $92.78 - A critical lower support, indicating deeper market corrections if S1 fails.
Technical Indicators:
MACD (Moving Average Convergence Divergence): The MACD is below its signal line, indicating bearish momentum.
RSI (Relative Strength Index): The RSI is at 40.73, close to entering the oversold territory, which might indicate a potential for price stabilization or reversal if it dips further.
Analysis and Conclusion:
The SOL/USDT pair is currently in a delicate position, hovering just above a crucial support level at $116.96. The recent price decline and the bearish MACD suggest that the market is under some pressure. However, the proximity of the RSI to oversold conditions could imply that a bounce back may occur if the support holds strong, potentially driving the price toward R1 at $193.09.
The strategy for traders in this scenario should be to closely monitor the $116.96 support level. A sustained break below this level could trigger further declines toward S2 at $92.78, while a rebound from this support could offer a buying opportunity with targets at higher resistance levels.
For now, it's advisable to watch for any bullish signals, such as a positive crossover in the MACD or a rebound in the RSI from oversold levels, which could suggest an impending recovery. Conversely, continued weakness in these indicators might suggest extending the bearish outlook.
In summary, SOL's market dynamics suggest a testing time ahead. Traders should remain vigilant, monitor key technical levels closely, and be prepared to adjust their positions based on price action and indicator signals. Always consider using stop-loss orders to manage risks effectively in this volatile market environment.

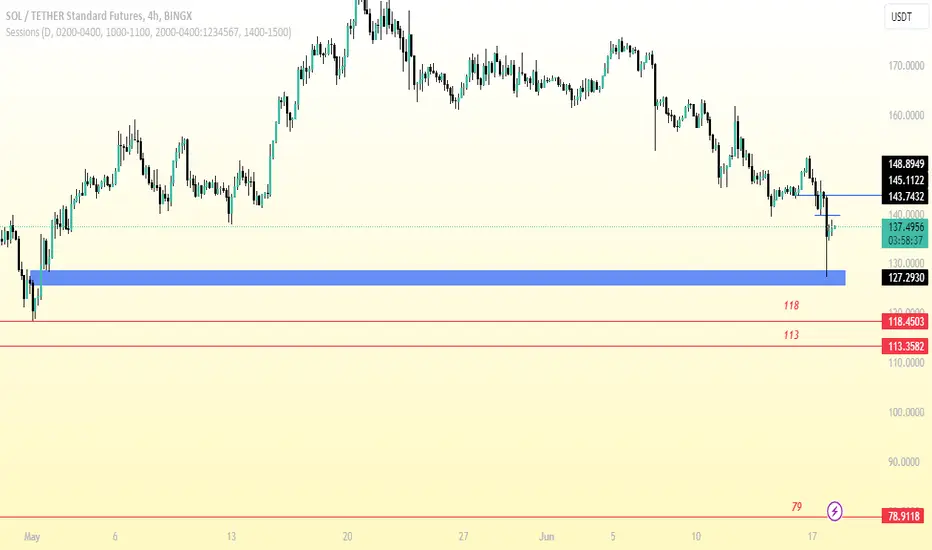
Solana, Tue 18 Jun, Price Movement, Part 2I always forget somethings, I am old now,lol
I forgot to save profit, and when Go for Lunch, My SL hit!
I review again my Weekly Analyze and see the price in 4H TM.
I see the other targets: 118, 113 and 79 $!
I Know the best thing is, wait till Wed or Thursday But...
I will use the Fibo from Today`s High to Today`s Low, and then check in NY session.
Try another Trade with low risk and try to Size management!
Is it short possible now?Maybe, if setup form, can get short position!
Its Monday, Cant trust this day!
what do you think?
Mon 17 Jun- 10:43

SOL preppin again for a new round of PRICE GROWTH!SOL has been tamed town a bit after an aggressive rise to 126 -- and correcting healthily below 100.
This bluechip coin has seen exponential growth from being a single digit priced asset.
Based on recent 4h price data, the coin is preppin another round of price growth from the new higher base at 100.
This level seems to be a strong psychological level, a major order block support where buyers are now converging.
A retest of the previous peak at 126 and a possible strong break is highly possible.
Spotted at 100.
TAYOR.

Solana., Long!I still looking for Sharp Short ( Pm Session),
But I took Long Position Now.
Thu 13 Jun 10:45

solana 4H AnalysisBased on price action analysis, this chart can be considered as the most probable chart. This analysis is based on a 4-hour time frame. This is not a buy or sell offer. Please consider all aspects yourself.

SOLUSDT Here is an update on #SOLUSDT that we took yesterday. We are in Profit, with a Stop Lose set. Let's see how far down we go!
M.J.

Is it possible to return the price?📊 Due to the decrease in the downward momentum of the price movement, in the event of the failure of the upward downward movement pattern and stabilization of the price above the $155 range, the price may increase to the $162 range 🎯and in the case of the strength of the $170 range🎯🎯.
📊 Otherwise, the price may fall to the range of $144.

SOLANA, RECHARGEMENT ZONE! Over the last 3 weeks, SOLANA has fallen by around 25%.
While most people are panicking, all you have to do is look at the HTF chart to see what's going on.
We are back precisely on the 0.62 Fibonacci retracement, recovering an Order Block present in 1D but also in H4.
So I have a bullish view on SOLANA and I think we've reached the bottom.
So, as you can see, this retracement is rather healthy and necessary to continue its bullish rally! 🚀
I'm therefore going to favour buying on SOLANA, with the BOS (at $189) as my first target, and then the high of this cycle at $209!
Feel free to subscribe and put a boost on this post if you enjoyed my analysis.
Happy trading and have a good weekend :)

Solana (SOL): what's next for the coin's price?Over the past few weeks, Solana (SOL) has gained significant attention as its price continues to consolidate around crucial support lines. This consolidation follows Bitcoin’s latest struggle to validate a clear trend above the psychological mark of $70K. Amid the overall stable market sentiment, Solana has seen a mood swing in key on-chain metrics, creating possibilities of a significant move in the coming hours.
Solana has reached its 20-day Exponential Moving Average (EMA) at $159 on the 4-hour chart, which is likely to serve as a significant resistance point. Buyers have been accumulating aggressively in recent hours; however, sellers are strongly defending a surge. This has resulted in a consolidation in the price chart. As of now, SOL is trading at $154, down over 6% in the last 24 hours.
If the price advances past the moving averages and $162, it signals a potential resurgence by the bulls. In this scenario, the SOL/USDT pair may target a rally towards the next major resistance at the descending resistance line. If the price surpasses that level, we might see a climb toward $192.
Conversely, if the price declines from the moving averages, it suggests increasing negative sentiment with traders selling during price rallies. This could drive the price down towards the solid support zone of $130-$140. A break below this threshold could result in a further decline to $100.
WHITEBIT:SOLUSDT

Wednesday is Jenna Ortega` Day?Yesterday afternoon, I took a good long position, but the movement of the price and candles was very suspicious. I closed the position with very little profit.
This morning, the continuation of that long position could be taken, but the suspicious movement of the candles still affected me.
With this candle and sharp movement, I will wait to get a good short position if the conditions are ready!
Did you see the TV series Wednesday?
The second season is coming!
Wed 12 June - 9:18 Am

Solana (SOL): Possible Breakdown of 200EMA / Double Top Pattern?Solana had made a nice pattern for us here "Double Top". With pattern still forming, we keep an eye on that neckline zone, which has aligned with 200EMA.
We are looking to see a touch to that zone and full-scale breakdown from there as well 😉
Swallow Team

SOLANA - Macro DistributionThis is an idea I had posted about a while back that is starting to play out. Now that we have a full picture, it's pretty safe to say that this is a macro distribution. The weekly & monthly TD sequential have both printed 789, which also marked the macro top last cycle. As much as it pains me to consider this possibility, this bull run may get cut short if this plays out

#SOLUSDT, $$$ Bullish opportunity for mid long termWelcome, Trader. Welcome to our cryptocurrency community!
We are going to discussing #SOLUSDT 💹
#SOLUSDT 🔥🚀
---------------
Update:
#LSOL forming a descending channel pattern over a 4 Hr time frame 👉✅.
Liquidity is taken. Currently trading on the major support zone.✔😉
If it shows bullish momentum, we'll get a minimum of 16% move very soon📈👀
Crypto Analyst Hub
#crypto #cryptocurrency #bitcoin #ethereum #blockchain #btc #cryptotrading #cryptonews #eth #cryptocurrencies #nft #bitcoinnews #bitcoins #trading #bitcoinmining #forex #binance #cryptoart #nfts#trading #forex #trader #investing #stocks #forextrader #stockmarket #daytrader #forextrading #invest #bitcoin #daytrading #cryptocurrency #crypto #investor #investment #forexsignals #nse #chartpattern #cedarforex #candlepatterns #learntrading #bseinstitute #shorttermtrade #bankniftytrading #stockmarketph #calloptions #mqlsignal #futuretrader #tradingmemes #chartpatterns #tradingview #tradinglife #tradinglifestyle #tradingstrategy #tradingtips #tradingplan #tradingsignals #tradingaccounts #tradingsignal #tradingforex #tradingsync #tradingroom #litecoin #ethereum #bitcoincash #cryptocurrencies #ripple #btc #bitcoinnews #bitcoinmining #blockchain #eth #bitcoin #bitcoins #coinbase #cryptocurrency #crypto #bitcointrading #dogecoin
BTC
ETH
USDT
PEPE
DOGE
ALT

Solana, Road to $276Solana reach a strong trendline support, and perform a symmetrical triangle pattern.
If you wanna follow bullish at solana,
this is the right moment to enter with short term target at $169,
and if this pattern break up, my target at symmetrical triangle projection at $276.99 with 89% profit
I will update this analysis if i found a new key level.
thanks.
Btw, there is a lot of bullish coin today, If you have any request analysis, fells free to write it at comment.

Solana (SOL): Navigating future challengesIn the fast-paced world of cryptocurrencies, Solana (SOL) has emerged as a remarkable contender, offering a unique blend of cutting-edge technology and robust performance. This article delves into Solana's distinctive features, its historical journey through the crypto landscape, and the current technical indicators that shape its path forward.
Solana Unveiled: A Speedy Blockchain Paradigm
Solana is not your average cryptocurrency; it's an entire crypto computing platform with a clear mission—to deliver lightning-fast transaction speeds while maintaining decentralization. Solana achieves this ambitious goal through a series of innovative approaches, with its native cryptocurrency, SOL, serving as the fuel for transactions and staking.
The platform has made significant strides by introducing groundbreaking concepts such as the "proof of history" mechanism. This innovative approach enhances its transaction throughput without compromising on the core principles of decentralization, providing users with a powerful, scalable, and efficient blockchain network.
A Historical Perspective: The Volatile Odyssey of SOL
Solana's journey began with its introduction to the trading world on OKX in early 2021, sporting an opening price of $3.020. Much like the broader crypto market, Solana experienced a rapid adoption phase characterized by swift price appreciation.
The initial 415% rally in the first 33 trading days was a testament to SOL's appeal to both novice and seasoned crypto enthusiasts. During this period, SOL's price identified significant support and resistance levels at $6.115, $9.235, $12.35, and a major resistance point at $17.615.
Following this bullish phase, Solana entered a 32-day sideways movement with an average swing of 30% in either direction. A breakout from this range occurred, propelling SOL's price to reach new support and resistance levels at $27.5 and $55.915, respectively.
However, a significant reversal transpired on May 19th, 2021, as SOL faced a formidable rejection at the $55.915 resistance level. The ensuing 63.64% price drop in just five days found support at a previously established daily AOI (Area of Interest), represented by the dotted grey line.
Over the next 68 days, SOL's price coiled within a range, signaling that buyers were regaining control. The subsequent breakout tested the $55.915 level, and SOL's price surged past it, rallying further to encounter new resistance at $78.50.
Following a brief period of sideways trading, SOL achieved another robust breakthrough of this resistance, continuing its parabolic ascent. New support and resistance levels emerged at $94.50, $118.55, $138.50, and $191.10, culminating in an all-time high of $259.88 on November 6th, 2021. This marked the initiation of a relentless downtrend, and the end of a 614% rally.
SOL's descent persisted for 125+ days, finding a major support point at $78.5. A subsequent breakout from the established downtrend hinted at a potential rally to the $138.50 support turned resistance level. Unfortunately, SOL's price faced rejection at this juncture, signaling the continuation of the downtrend.
The collapse of FTX further exacerbated SOL's downward trajectory, causing its price to plummet by over 92% from $118.55 to $9.235.
The Current Scenario: Resurgence Amidst Sideways Drift
Since discovering support at $9.235, SOL embarked on an impulsive journey, briefly revisiting $23.5. However, this rebound proved short-lived and failed to surpass the pre-collapse FTX levels.
SOL has since been meandering sideways, marked by an average swing of 15% in either direction. Importantly, it has not managed to break the current downtrend.
From June 5th, 2023, to July 7th, 2023, SOL initiated a robust V-shaped recovery (Indicated by the BOX) off the $14.455 support level, accompanied by the establishment of a potential new supportive trend and a cross below the 20 level indicating that we could have a potential reversal. A breakout above $17.675 yielded a 55.59% gain to the resistance at $27.5.
At present, SOL has experienced a strong bounce off the $17.675 support level, reinforcing the newly formed daily supportive trend. However, resistance has materialized around $23.50.
The Road Ahead: Balancing on a Precipice
SOL's current trajectory hinges on its ability to breach the $23.50 resistance level convincingly. Failing to do so could lead to a descent towards the AOI daily line at $20.291, serving as a potential entry point for both long and short positions.
Let's examine the critical indicators:
* ROBO is currently bullish, generating 2 out of 3 signals following the breakout from the daily AOI level.
SOL's price remains above the 50-day and 200-day Exponential Moving Averages (EMA). While the current sentiment is bearish, the potential for a golden cross (50 EMA crossing above 200 EMA) looms on the horizon.
Trading above the McGinley strip further reinforces the bullish outlook.
Nevertheless, it cannot be overstated that SOL must surpass $23.50 or secure support at the 200 DEMA or the AOI daily to maintain this bullish momentum. Failure to find support at these levels or a break of the supportive uptrend could lead to a revisitation of $17.675 or even a deeper descent to $15.471.
As always, in the ever-evolving crypto landscape, the wisest approach is to react to predictions rather than predict reactions. SOL's price action reflects the relentless dynamism of the crypto market, where technical indicators and historical context guide our journey through the blockchain frontier.

✴️ Solana 4X SHORT (222% Profits Potential)Solana peaked March 2024, together with Bitcoin.
One month later, April 2024, a market correction was confirmed. This is confirmed by the fact that support broke, in this case we have a "cap" pattern.
➖ Notice the shooting star, inverted hammer and upper shadows on the candles; all the action has been bearish since the peak session in March.
➖ There is potential for a bearish continuation based on the fact that we have lower volume every session, a weak MACD, lower highs and strictly bearish marketwide action.
My numbers are shared with you for illustration purposes only and should not be construed as financial advice.
Make sure to do your own research.
I am not responsible for your actions.
You are responsible if you win or lose.
This is not financial advice.
__
SHORT SOLUSDT
Leverage: 4X
Buy-in: $165 - $143 | Cp: $145
Targets:
1) $130
2) $115
3) $95
4) $85
5) $78
6) $64
Stop-loss: Close daily above $170
Potential profits: 224%
Capital allocation: 4%
___
Thank you for reading.
Wishing you maximum health, wealth, success, and growth.
👉 You deserve the best!
Namaste.

Monday, Monday, Cant Trust that Day!I was checking and studying on the weekly time frame, but the power went out.
What will happen if we don't have electricity and water?
I started watching the Fallout series. I had seen Silo and Lastofus series before.
never mind
Let's live in the present, forgetting the past and carefree about the future!
Banks are closed. Before 10 o'clock, a long setup was formed.
I came to take action, to be honest, I was scared and chose a lower entry price to reduce my risk... but the price did not reach the entry point and went up.
Of course, I still expect the position of the shorts to be much, much better, because I still see the market bearish.
I don't like going uphill, downhill is much better!
I will wait for hit the Highs, of today's or Sunday's and then if it happens, I will sell shorts.
Monday, Monday, Cant Trust that Day!
