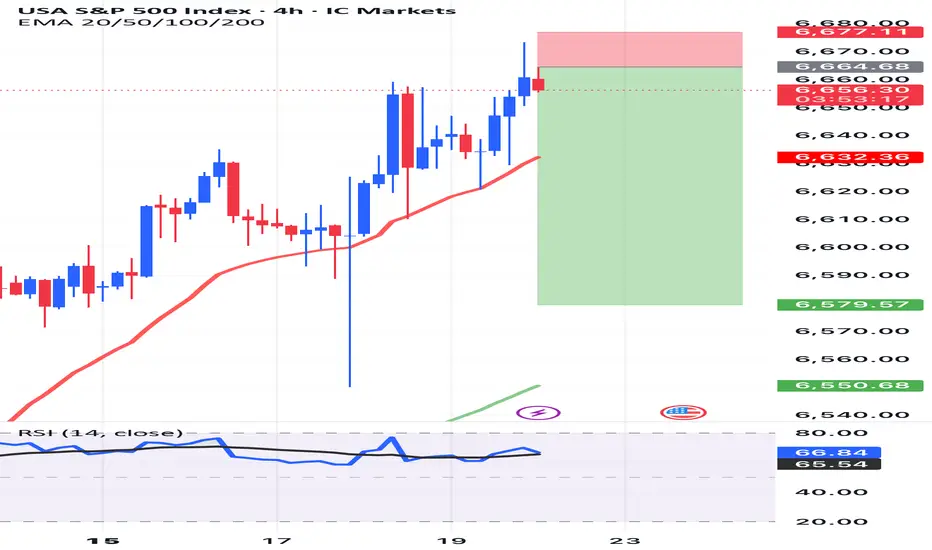
US500 (S&P500) Projection📊 US500 (S&P500) Forecast | Intraday & Swing Outlook 🚀📉
Asset Class: US500 CFD (SPX, SPY, S&P500)
Current Closing Price: 6,661.8 (20th Sept 2025, 12:50 AM UTC+4)
🔎 Market Overview
The S&P500 remains highly volatile as it consolidates near all-time highs. Both bullish continuation and reversal traps are emerging.
We integrate Elliott Wave 🌊, Ichimoku ☁️, Gann 🔺, and VWAP 📏 tools to frame trade setups.
⚡ Intraday Technical Levels
Immediate Support: 6,635 – 6,610 🟢
Key Resistance: 6,690 – 6,725 🔴
VWAP Zones: Anchored support at 6,628 📏
RSI: Neutral (52) → room to swing both sides 📈📉
🎯 Intraday Trade Ideas
Buy (Scalp): 6,620 – 6,635 🛒
Target: 6,670 → 6,690 🚀
Stop Loss: Below 6,600 ❌
Sell (Scalp): 6,690 – 6,710 🛑
Target: 6,645 → 6,625 📉
Stop Loss: Above 6,730 ❌
⏳ Swing Trading Outlook
Swing Support: 6,580 – 6,520 📉
Major Resistance: 6,750 – 6,820 🚀
Ichimoku Cloud: Bullish bias (daily/weekly) ☁️
Wave Count: Elliott suggests Wave 4 consolidation before Wave 5 breakout 🌊
🎯 Swing Trade Ideas
Buy (Swing): 6,580 – 6,600 🛒
Target: 6,720 → 6,800 🚀
Stop Loss: 6,520 ❌
Sell (Swing): 6,750 – 6,820 🛑
Target: 6,640 → 6,600 📉
Stop Loss: 6,860 ❌
📐 Pattern Watchlist
⚠️ Potential Bull Trap: Above 6,725 – rejection zone
⚠️ Head & Shoulders risk: Breakdown below 6,580
📏 Gann Levels: Time cycle indicates critical reversal window next week
☁️ Ichimoku Twist: Signals momentum shift by month-end
📌 Strategy Recap
🎯 Intraday Bias: Range trade → watch VWAP flips 📊
📈 Swing Bias: Bullish above 6,600, bearish below 6,580 🔑
⏳ Patience Key: Avoid chasing breakouts without volume confirmation 📉📊
🧭 Conclusion
The US500 (S&P500) is at a make-or-break zone.
✅ Buy dips near 6,600
❌ Sell rallies into 6,750 – 6,820
🔮 Expect volatility as macro events drive direction
📊 Stay disciplined, trade the levels, and adapt quickly 🚀📉
For individuals seeking to enhance their trading abilities based on the analyses provided, I recommend exploring the mentoring program offered by Shunya Trade. (Website: shunya dot trade)
I would appreciate your feedback on this analysis, as it will serve as a valuable resource for future endeavors.
Sincerely,
Shunya.Trade
Website: shunya dot trade
📝 TRADING CHECKLIST
Before entering any position:
- ✅ Confirm volume supports move
- ✅ Check RSI for divergences
- ✅ Verify multiple timeframe alignment
- ✅ Set stop loss before entry
- ✅ Calculate position size
- ✅ Review correlation with DXY/SPX/US30
- ✅ Check economic calendar
- ✅ Assess market sentiment
⚠️Disclaimer: This post is intended solely for educational purposes and does not constitute investment advice, financial advice, or trading recommendations. The views expressed herein are derived from technical analysis and are shared for informational purposes only. The stock market inherently carries risks, including the potential for capital loss. Therefore, readers are strongly advised to exercise prudent judgment before making any investment decisions. We assume no liability for any actions taken based on this content. For personalized guidance, it is recommended to consult a certified financial advisor.
SPIUSD trade ideas

Will Fed rate cuts provide further upside for US500?
On the eve of the FOMC meeting, US indices traded cautiously as stronger August retail sales reignited concerns over inflation risks. Retail sales rose 0.6% MoM, beating the 0.3% consensus. Charles Schwab noted that despite weak August jobs data, consumer spending remains resilient, supporting Q3 growth.
Industrial production also surprised to the upside at 0.1% (cons. -0.1%), with manufacturing output—the largest component—up 0.2% on a rebound in autos.
US500 remains within the ascending channel, maintaining a steady uptrend. The widening gap between both EMAs suggests the potential continuation of bullish momentum. If US500 holds above both EMAs, the index may gain upward momentum toward the psychological resistance at 6700. Conversely, if US500 breaks below the 6530 support, the index could retreat toward 6340.

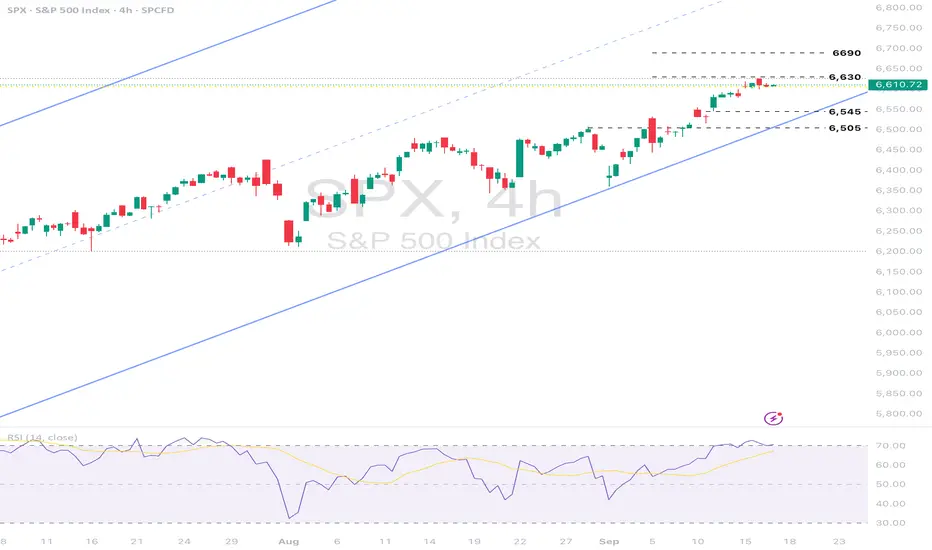
US500: Disconnection between equity prices & broad economic dataThe US500 is trading near record highs with the index up nearly 18% over the year. The market is driven by optimism about an imminent Fed rate cut, robust Q3 earnings, and continued strength in large cap tech shares, but fundamental valuation concerns and signs of overbought technical conditions persist.
Fundamental Analysis
The rally is resting on expectations that the Federal Reserve will announce its first 2025 rate cut this week, likely by 25 basis points.
Mega cap tech and rate sensitive sectors are leading gains, but economic headwinds remain, unemployment is ticking higher, and indicators like retail sales and leading economic indicators have weakened.
Valuations among the top US500 stocks are stretched, with the top 10 names trading at a forward P/E of 30x well above historical averages and record levels of cash hoarding notably by Berkshire Hathaway are raising caution flags.
Disconnection between equity prices and broad economic data is notable, with softening consumer metrics and elevated corporate bankruptcies.
Technical Analysis
Technical signals remain mostly bullish, as the index continues to trade within a strong uptrend and posts new highs.
Short-term technical indicators such RSI show overbought conditions and weak breadth could signal fatigue.
Key support is found at 6,545, then at 6,505 while immediate resistance is at the all-time high and then at projected levels of 6,630 ahead of 6,690.
Analysis by Terence Hove, Senior Financial Markets Strategist at Exness
Why Forex Reserves Matter in Trading1. What Are Forex Reserves?
Forex reserves are assets held by a nation’s central bank in foreign currencies, precious metals like gold, Special Drawing Rights (SDRs) from the International Monetary Fund (IMF), and other reserve assets. These reserves are not just passive holdings; they are active instruments used for monetary policy, currency stabilization, and ensuring global payment obligations.
Key Components of Forex Reserves
Foreign Currencies – Typically held in USD, EUR, JPY, GBP, and increasingly CNY.
Gold Holdings – A traditional hedge against inflation and currency risk.
SDRs (Special Drawing Rights) – An IMF-backed reserve asset that supplements official reserves.
IMF Reserve Position – Access to IMF funding if needed.
2. Why Countries Accumulate Forex Reserves
Stability in Currency Markets
Countries need reserves to intervene in forex markets to prevent excessive volatility in their domestic currency.
Confidence for International Trade
Exporters and importers prefer dealing with countries that can guarantee payment stability.
Debt Servicing
Reserves allow governments to service foreign debt obligations without defaulting.
Buffer Against Economic Shocks
Acts as insurance against sudden capital flight, trade imbalances, or geopolitical crises.
Support for Sovereign Credit Ratings
Higher reserves improve investor confidence and reduce borrowing costs.
3. Importance of Forex Reserves in Global Trading
3.1 Stabilizing Currency Values
A currency’s exchange rate plays a central role in trade competitiveness. For example, if the Indian Rupee depreciates too rapidly, imports like oil and electronics become expensive. The Reserve Bank of India (RBI) can sell USD from its reserves to supply dollars in the forex market, stabilizing the rupee.
3.2 Controlling Inflation
Imported inflation is a major risk for countries dependent on foreign goods. By using reserves to maintain a stable currency, central banks reduce inflationary pressures, which directly impacts stock and bond markets.
3.3 Investor Confidence
High reserves attract foreign institutional investors (FIIs) because they see lower risk of capital restrictions. Conversely, low reserves signal vulnerability, causing capital flight.
3.4 Crisis Management
During the 1997 Asian Financial Crisis, countries with low reserves like Thailand suffered massive currency collapses, while nations with higher reserves recovered faster.
4. How Forex Reserves Impact Trading Across Markets
4.1 Currency Trading (Forex Markets)
Traders closely monitor reserve levels to predict central bank interventions.
A rise in reserves indicates strong capital inflows or trade surpluses, usually strengthening the currency.
A fall in reserves may mean heavy intervention to defend the domestic currency, creating volatility.
4.2 Equity Markets
Strong reserves signal economic resilience, attracting long-term investments.
For export-driven companies, reserve usage can stabilize currency swings, reducing earnings risk.
4.3 Bond Markets
Nations with healthy reserves are seen as safer borrowers.
Sovereign bond yields fall when reserves are high, lowering borrowing costs.
4.4 Commodity Trading
Forex reserves influence global demand for commodities. For example, when China builds reserves, it often buys U.S. Treasuries and commodities, boosting global demand.
Gold prices also respond directly to central bank reserve diversification strategies.
5. Case Studies: Forex Reserves and Trading Dynamics
5.1 China
Holds the world’s largest reserves (over $3 trillion).
Uses reserves to keep the yuan stable, ensuring export competitiveness.
Global traders watch China’s reserve reports to gauge trade and commodity flows.
5.2 India
As of 2025, India’s reserves are above $650 billion.
Provides a cushion against oil import costs and FII outflows.
Traders interpret rising Indian reserves as bullish for the rupee and equity markets.
5.3 Russia (Post-Sanctions)
Sanctions froze Russia’s dollar reserves in 2022.
Moscow shifted to gold and yuan, changing global reserve composition.
Traders saw sharp volatility in ruble trading due to limited access to USD reserves.
6. Forex Reserves as a Trading Indicator
For traders, reserves serve as a leading indicator of currency and capital flow trends.
Rising Reserves: Suggests export growth, capital inflows, and stable currency → bullish sentiment.
Falling Reserves: Signals interventions, capital flight, or trade deficits → bearish sentiment.
Traders often combine reserve data with:
Balance of Payments (BoP) reports
Capital account movements
Central bank policy signals
7. Risks of Over-Reliance on Reserves
While reserves are critical, there are risks:
Opportunity Cost – Funds invested in low-yield assets like U.S. Treasuries could have been used domestically.
Geopolitical Risk – Sanctions can freeze reserves held abroad.
Currency Depreciation of Reserve Assets – Holding too many USD assets can hurt if the dollar weakens.
False Security – Excessive reliance may delay structural economic reforms.
8. Future of Forex Reserves in Global Trading
Shift Toward Gold & Yuan – Central banks are diversifying away from the USD.
Digital Reserves (CBDCs) – Future reserves may include digital currencies issued by central banks.
Geopolitical Weaponization of Reserves – The Russia-Ukraine war highlighted how reserves can be frozen, making diversification essential.
AI and Data-Driven Reserve Management – Advanced analytics will improve reserve allocation strategies.
9. Lessons for Traders and Investors
Currency traders should track reserve levels as part of fundamental analysis.
Equity investors should see reserves as a buffer against volatility.
Bond traders should link reserves with sovereign credit risk.
Commodity traders should monitor how reserve diversification affects gold and oil demand.
Conclusion
Forex reserves are not just a financial cushion for governments; they are a critical trading signal that reflects a country’s economic health, ability to withstand crises, and global credibility. From stabilizing exchange rates to influencing global capital flows, reserves touch every corner of financial markets.
For traders, understanding the dynamics of reserves means being able to anticipate currency movements, equity flows, bond yields, and commodity prices with greater accuracy. In a world of heightened volatility, forex reserves remain one of the most powerful forces shaping international trade and financial stability.
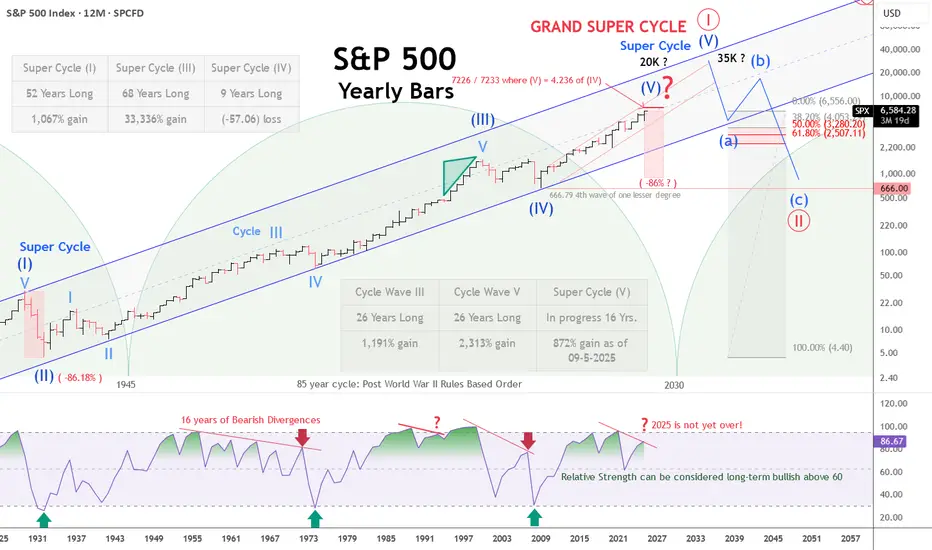
The swan songCould be near the end, 7 years from completing Supercycle wave (V) and so Grand Supercycle wave .
Target for Grand Supercycle wave could be the territory of Supercycle wave (IV).

SPX updated.No sign of a turn as yetNo real reaso to sell as yet.The character of the chart needs to change
US500Success in forex and stocks comes from a combination of knowledge, discipline, and patience. Understanding market trends, economic factors, and company
fundamentals is crucial, but equally important is controlling emotions and sticking to a well-planned strategy. Continuous learning, adapting to changing conditions, and managing risk wisely can turn opportunities into consistent growth over time.
Consistency, not luck, separates successful traders from the rest.
Of course. Here is the English translation of the analysis for tOf course. Here is the English translation of the analysis for the US500 (S&P 500 index):
The US500 (S&P 500 Index) is the most authoritative benchmark for gauging the overall health of large-cap U.S. stocks. Covering 11 major sectors, its diversified nature makes it a "barometer" of the U.S. economy. The index is currently trading at all-time highs, driven by a combination of market expectations for Fed rate cuts and the resilience of corporate earnings. It is extremely sensitive to monetary policy; any surprises in inflation (CPI/PCE) or employment data can reshape the interest rate path and trigger a market repricing.
Sector rotation within the index is a key focal point. While the leadership of tech giants remains the main engine for gains, the performance of cyclical sectors like energy, financials, and industrials is crucial for market breadth and sustainability, signaling confidence in an economic "soft landing." From a technical standpoint, the 5,300 area has become a new battleground for bulls and bears. If constituent earnings continue to exceed expectations, the index could consolidate its upward momentum; conversely, it faces pullback pressure in a high-valuation environment.
Looking ahead, the direction of the US500 will be a tug-of-war between "AI-driven earnings growth" and "higher-for-longer interest rates." Investors should pay balanced attention to mega-cap earnings and broad economic data to assess whether the momentum can broaden. Short-term volatility is inevitable, while the long-term trend remains anchored on whether the U.S. economy can avoid a recession.
SPX500 – New Highs as Nvidia–OpenAI Deal Lifts Market SentimentSPX500 – Overview
U.S. indices hit new highs as markets digested fresh headlines, including Nvidia’s (NVDA) plan to invest up to $100 billion in OpenAI, with the first data-center gear expected to ship in the second half of 2026.
Analysts are split on the deal: bulls view it as confirmation that OpenAI sees no alternative to Nvidia GPUs, while skeptics question why Nvidia would fund a customer to buy its own equipment.
Attention also turns to the September flash PMIs, which will test U.S. economic resilience amid tariffs. Australian PMIs disappointed, but they carry little correlation to U.S. growth.
Technical Analysis
SPX500 has reached the key 6,700 resistance and is stabilizing above it, signaling continuation of the bullish trend while price trades above this pivot.
Bullish Path:
As long as price holds above 6,700, upside targets remain 6,722 → 6,742 → 6,780.
A strong 1H close above 6,742 would confirm further bullish extension.
Bearish Path:
A confirmed 1H close below 6,698 would signal a short-term correction toward 6,670.
For a deeper bearish shift, price must break the 6,663 pivot on a 1H close, opening the way to 6,634.
Key Levels
Pivot: 6,700
Resistance: 6,722 – 6,742 – 6,780
Support: 6,672 – 6,663 – 6,634


Sea Routes & Supply Chains1. The Historical Foundation of Sea Routes
1.1 Ancient Maritime Trade
Maritime trade is as old as civilization itself.
The Phoenicians of the Mediterranean (around 1500 BCE) mastered navigation and spread commerce across North Africa, the Middle East, and Southern Europe.
The Silk Road by sea connected China, India, Arabia, and Africa, long before modern globalization. Spices, silk, and precious stones moved across oceans, shaping cultures and economies.
In South Asia, the Indian Ocean trade system linked ports from East Africa to Southeast Asia. Seasonal monsoon winds powered dhows and junks carrying pepper, gold, and textiles.
1.2 Age of Exploration and Colonization
The 15th and 16th centuries marked a turning point. European powers—Portugal, Spain, the Netherlands, and later Britain—sought new sea routes to bypass land-based trade monopolies.
Vasco da Gama’s voyage to India (1498) opened Europe to Asian spices.
Columbus’s Atlantic crossing linked Europe with the Americas.
Britain’s mastery of naval power allowed it to dominate maritime routes, turning sea trade into imperial control.
Sea routes became instruments of wealth and power, laying the groundwork for today’s globalized supply chains.
2. Sea Routes: The Arteries of Modern Trade
2.1 Major Maritime Routes
Modern maritime trade relies on established routes shaped by geography and economics.
The Suez Canal Route: Connecting Europe and Asia via the Mediterranean and Red Sea. It shortens the Europe-Asia journey by nearly 7,000 km compared to circumnavigating Africa.
The Strait of Hormuz: A narrow chokepoint through which one-fifth of the world’s oil supply passes.
The Strait of Malacca: Linking the Indian and Pacific Oceans, this is one of the busiest shipping lanes in the world.
The Panama Canal: Vital for connecting the Atlantic and Pacific, especially for trade between the Americas and Asia.
The Trans-Pacific Route: Connecting East Asian manufacturing hubs (China, Japan, South Korea) with North American markets.
The Trans-Atlantic Route: Linking Europe and North America, critical for goods, energy, and raw materials.
2.2 Strategic Chokepoints
These routes rely on chokepoints, narrow maritime passages that, if disrupted, can cripple trade. The Strait of Hormuz, Malacca, and Bab el-Mandeb are classic examples. Piracy, blockades, or accidents in these areas can trigger global economic shockwaves—as seen when the Ever Given blocked the Suez Canal in 2021.
2.3 Cargo Diversity
Sea routes transport a staggering variety of goods:
Bulk commodities: oil, coal, iron ore, grains.
Containerized goods: electronics, apparel, machinery.
Liquefied gases: LNG and LPG.
Specialized cargo: cars, chemicals, refrigerated food (reefer containers).
The efficiency of sea routes lies in their ability to handle massive volumes cheaply compared to air or land transport.
3. Supply Chains: The Skeleton Behind Sea Routes
3.1 What Is a Supply Chain?
A supply chain is the entire process of sourcing, manufacturing, and delivering goods. It includes suppliers, factories, warehouses, transport hubs, shipping lines, and retailers. Sea routes act as international connectors within this chain.
3.2 Globalization and the Rise of Complex Supply Chains
From the late 20th century, businesses adopted “just-in-time” production to minimize inventory and reduce costs. Manufacturers sourced parts globally, relying on efficient shipping. For example:
A smartphone may have components from South Korea, semiconductors from Taiwan, assembly in China, and final sales in the U.S.
Automakers source steel from Brazil, engines from Germany, and wiring harnesses from Mexico.
Sea routes enable this complex web, making supply chains international in scope.
3.3 Containerization Revolution
The introduction of the shipping container in the 1950s revolutionized logistics. Standardized containers allowed goods to move seamlessly between ships, trains, and trucks. This reduced theft, increased efficiency, and lowered shipping costs dramatically. Today, mega-container ships can carry over 20,000 TEUs (Twenty-foot Equivalent Units), making sea transport the backbone of global supply chains.
4. Geopolitics of Sea Routes and Supply Chains
4.1 Naval Power and Trade Control
Sea routes are not just commercial pathways but also strategic assets. Countries with strong navies—like the U.S., China, and historically Britain—use maritime dominance to secure trade. Control over chokepoints gives nations leverage in global politics.
4.2 Belt and Road Initiative (BRI)
China’s Maritime Silk Road, part of the BRI, seeks to expand its influence by investing in ports and shipping infrastructure worldwide. From Gwadar in Pakistan to Piraeus in Greece, China is reshaping maritime geopolitics.
4.3 Trade Wars and Supply Chain Shifts
U.S.–China tensions have exposed vulnerabilities in supply chains. Companies are “China+1” strategies, diversifying manufacturing to Vietnam, India, or Mexico. Yet, all these shifts still depend on sea routes for global distribution.
4.4 Vulnerability to Conflict
Conflicts in Ukraine, the South China Sea, or the Middle East can disrupt supply chains. Sanctions and blockades weaponize trade routes, showing how economic security is intertwined with geopolitics.
5. Challenges Facing Sea Routes and Supply Chains
5.1 Disruptions
Pandemics: COVID-19 exposed supply chain fragility when ports shut down, containers piled up, and shipping costs soared.
Piracy: Particularly in the Gulf of Aden and parts of Southeast Asia.
Climate Change: Rising sea levels, stronger storms, and melting Arctic ice are reshaping routes.
5.2 Environmental Concerns
Shipping contributes about 3% of global CO₂ emissions. Heavy fuel oil pollutes air and oceans, prompting stricter environmental regulations. The push for green shipping—using LNG, hydrogen, or wind-assisted propulsion—is gaining momentum.
5.3 Infrastructure Strain
Mega-ships require deeper ports and better logistics hubs. Not all regions can afford the infrastructure, creating bottlenecks in global trade.
6. The Future of Sea Routes and Supply Chains
6.1 Technological Transformation
Digitalization: Blockchain and AI are streamlining documentation and tracking shipments.
Autonomous Ships: Trials are underway for crewless vessels that reduce costs and risks.
Smart Ports: Automated cranes and AI-driven logistics increase efficiency.
6.2 Arctic Sea Routes
As ice melts, the Northern Sea Route along Russia and the Northwest Passage through Canada are becoming viable. These routes cut travel time between Asia and Europe but raise environmental and sovereignty concerns.
6.3 Regionalization vs. Globalization
Some argue the world is moving towards regional supply chains due to geopolitical tensions and resilience concerns. For instance, the EU encourages near-shoring manufacturing, while the U.S. promotes domestic chip production. However, sea routes will remain indispensable for intercontinental trade.
6.4 Resilient Supply Chains
Companies are rethinking strategies:
Building redundancy (multiple suppliers).
Increasing stockpiles of critical goods (semiconductors, medicines).
Investing in predictive analytics for disruptions.
Conclusion
Sea routes and supply chains truly are the hidden arteries of the global economy. From the spice traders of antiquity to the container ships of today, oceans have been the lifeblood of commerce and civilization. They connect continents, fuel industries, and ensure the smooth functioning of daily life. Yet, they remain vulnerable to geopolitical rivalries, environmental pressures, and technological disruptions.
As the world faces climate change, rising protectionism, and shifting power balances, the future of sea routes and supply chains will demand innovation, resilience, and cooperation. They may be invisible to the average consumer, but every time someone picks up a smartphone, drinks coffee, or fills their car with fuel, they are directly benefiting from the silent yet powerful arteries that keep the global economy alive.
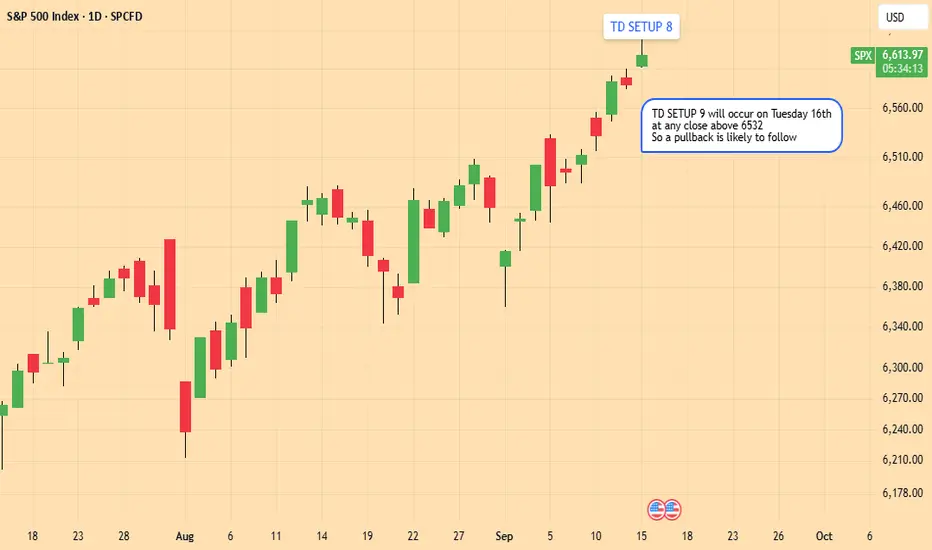
SPX : close to a pullbackToday's close will mark Tom Demark TD SETUP 8.
TD SETUP 9 is in the cards on Tuesday 16th September, after which a small pullback is likely
Crack-Up BOOM and BUSTHey everyone, Wave-Tech here. Join me on a historic journey as I reconstruct the Grand Super Cycle while diving into the historic and captivating world of Elliott Wave Theory!
This was to have been my maiden video cast—it didn't turn out as well as I hoped. Time got away from me, and the video ended abruptly before I could finish.
Rather than redoing it, I decided to keep the first and most authentic take intact for better or worse.
I made it private so that I could review it before publishing; however, I let too much time pass and was unable to change the setting back to public from private .
You can view the private video HERE :
The accompanying text is beneath the chart below:
In the simplest terms, Elliott Wave Theory is a measure of market psychology and sentiment coupled with Fibonnaci ratios designed to create a structural framework for determining at what stage of advance or decline a given market is in.
The basic premise for inherent advance and progress is three steps forward (impulse waves 1, 3, and 5) and two steps back (corrective waves 2 and 4).
According to Elliott, there are 9 degrees of trend, all of which are fractal in nature. The largest is the Grand Super Cycle, and the smallest is the Sub-Minuette.
Today, we’re exploring a yearly bar chart of the S&P, which covers trends at the Super Cycle and Cycle degree, revealing the pending culmination of a Grand Super Cycle—a colossal trend spanning centuries.
Buckle up as we unravel the rhythms of the stock market's epic ride!
The SUPER CYCLE:
Let’s start with the big picture: five waves of advance at the Super Cycle degree.
According to Ralph Nelson Elliott, with the sole exception of the GRAND SUPER CYCLE, the Super Cycle is the largest of all trends, a monumental set of impulsive and corrective waves that will set the tone and punctuate Grand Super Cycle terminals for Centuries to come—or at least through the fall of Empires or Civilizations.
Each of these waves tells a story of growth, correction, and renewal. The current Grand Super Cycle has been shaping markets and Nations for over a century. We can see this Grand Super Cycle unfolding in waves of Super Cycle dimension.
WAVE COUNTS:
The chart highlights five waves at Super Cycle degree: the first lasted 52 years with a gain of more than 1000%, the third stretched 68 years with a staggering 33,336% gain, and the fourth, a shorter 9-year span, saw a -57.06% loss, which marked the GFC low in 2009.
We are currently in the fifth Super Cycle wave, which is still unfolding and could mark the end of this Grand Super Cycle at any moment.
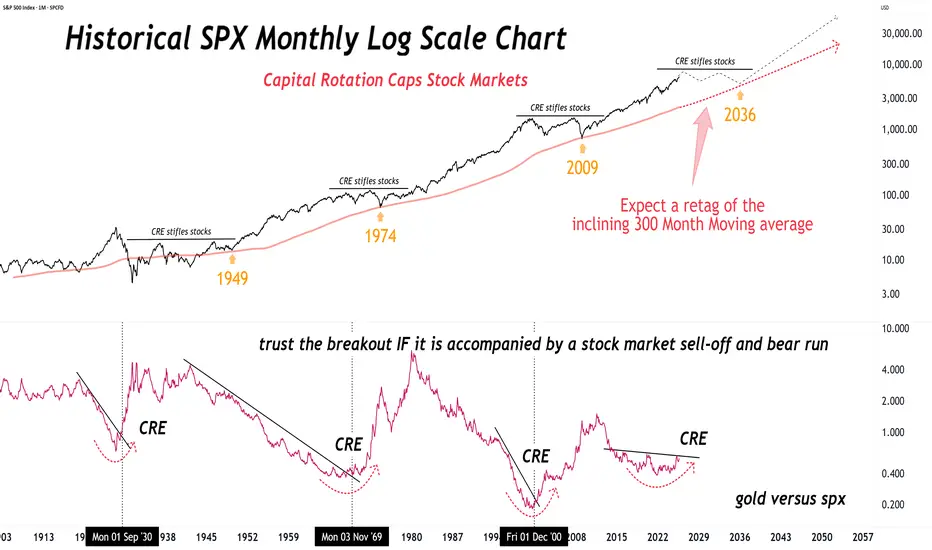
In contrast, the post-GFC "everything bubble" Crack-Up BOOM can persist to the upper trend channel boundaries noted near 18k and 35k.
Zooming in, we encounter the fractal Cycle degree waves comprising Super Cycle (III). Take Cycle Wave III and Cycle V, both 26 years long, delivering gains of 1,191% and 2,313% respectively.
And from the Super Cycle wave (IV) low in 2009, we are 16 years into Super Cycle Wave V, with an impressive 872% gain as of September 5, 2025.
This current wave could easily extend further, but its length is sufficient to suggest we may be nearing a pivotal turning point that might end the Grand Super Cycle with a sufficient black swan trigger.
The Fourth Turning:
Now, let’s touch briefly on the 85-year cycle, a rhythm that syncs beautifully with the concept of the "fourth turning"—a period of crisis and transformation.
The last one kicked off in 1945, post-World War II, ushering in the rules-based order that America and the West thrived in—an order that is arguably destined to end by 2030 if it hasn't already. This turning cycle hints at a historic shift on the horizon, or one that is currently already underway.
THE RSI:
Glance at the lower pane of the chart, where the Relative Strength Index (RSI) reveals a tale of caution. Since 1955, we’ve endured 16 long years of multiple bearish divergences—times when the market’s price and momentum didn’t align, signaling trouble ahead.
I like to call this the bearish divergences that cried wolf for nearly a generation! Note that it wasn't until the RSI closed beneath the mid-line that the sell-off into the 1974 low registered an oversold reading.
We saw the RSI fail again upon the new highs in 1993-94 following the highs in 1987.
1995 kicked off the infamous five years of irrational exuberance, which led to the tech bubble peak and subsequent crash into the 2002 low.
Not to be outdone by the 2000 blow-off top, the 2002 low ushered in yet another five years of irrational exuberance, culminating right in time for the 2008 Global Financial Crisis. This time, the RSI finally got it right on the first go round.
Currently, against the highs printed in 2021, the V-shaped snap-back rally following the mini bear market of 2022, the move to new highs in 2024 has flagged a bona fide bearish divergence. It will be interesting to see how the RSI looks after the close of 2025.
These divergences are like red flags, whispering that the party might not last forever, even though it may.
Price Targets:
So, where might this Super Cycle Wave V take us in terms of price? Let’s apply a Fibonacci projection—specifically, where Wave V equals 4.236 of Wave IV.
Doing the math, from the Wave IV base at 666.79, we’re looking at a target of around 7,226-7,233 on the S&P 500.
That’s only about 10% upside from recent highs—not quite the blow-off top of 18K or 35K, but a target to approach with eyes wide open.
Now, let’s consider a sobering scenario:
If Super Cycle Wave V ends here, or north of 7K, signaling the close of Grand Super Cycle ONE, history might repeat itself with a bear market akin to 1929’s four-year plunge.
An 86% decline could drop the S&P to around 917—still well above the Wave IV low of 666.79, another common target, but a stark reminder of the cycles’ power.
In Closing:
Thank you all for listening and reading if you've gotten this far. This was my first video. I got blindsided and cut off by the time constraint, so I apologize for the abrupt ending.
The market’s cycles and waves are a dance of numbers and human spirit, and we’ve only scratched the surface of their grandeur and implications.
Stay curious, stay informed, and keep your life vests on while riding these waves, okay!
When you start to think this time it's different...When you start to think this time it's different...
That nothing can stop stocks from going perpetually up...
Without taking their habitual decade long pauses...
Then that is when you should start to worry.
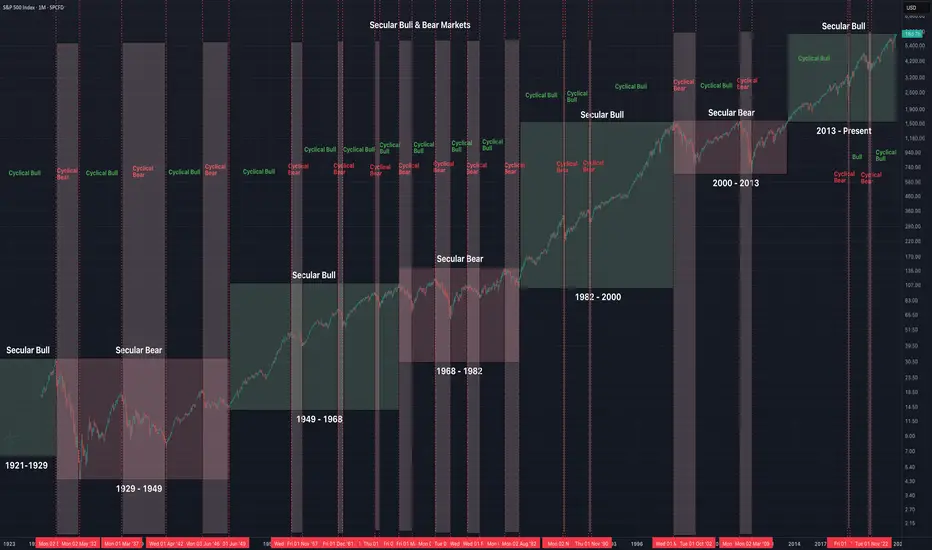
Secular & Cyclical Bull & Bear MarketsSecular vs. Cyclical Bull & Bear Markets (S&P 500, 1921–Present)
Secular Market Cycles (long-term)
Secular Bull:
1921–1929
1949–1968
1982–2000
2013–Present
Secular Bear:
1929–1949
1968–1982
2000–2013
Cyclical Market Cycles (shorter-term swings inside secular trends)
Cyclical Bears: 1929–1932, 1937–1942, 1946–1949, 1956–1957, 1961–1962, 1966, 1968–1970, 1973–1974, 1976–1978, 1980–1982, 1987, 1990, 2000–2002, 2007–2009, 2020 (COVID), 2022.
Cyclical Bulls: 1932–1937, 1942–1946, 1949–1956, 1957–1961, 1962–1966, 1966–1968, 1970–1973, 1974–1976, 1978–1980, 1982–1987, 1987–1990, 1990–2000, 2002–2007, 2009–2020, 2020–2022, 2022–Present.
Key Takeaways
Secular Bulls tend to last ~13–15 years on average, delivering powerful long-term gains with multiple smaller cyclical corrections along the way.
Secular Bears last ~13–16 years, usually defined by sideways price action with sharp rallies and deep drawdowns, leaving investors flat or negative after inflation.
Cyclical Bulls average ~4–5 years, while Cyclical Bears average ~1–2 years.
The current secular bull began in 2013 after breaking out of the 2000–2013 range.
S&P500 | Daily rising wedge | GTradingMethodGood morning fellow traders,
S&P price action is tightening inside a rising wedge on the daily chart, with volume steadily dropping.
Rising wedges often signal potential reversals, but with CPI on deck, volatility could go either way.
My guess, price tests top of rising wedge, finds resistance and down we go - a long way down.
Keen to hear your thoughts on whether CPI is going to be a catalyst for a breakout or breakdown?
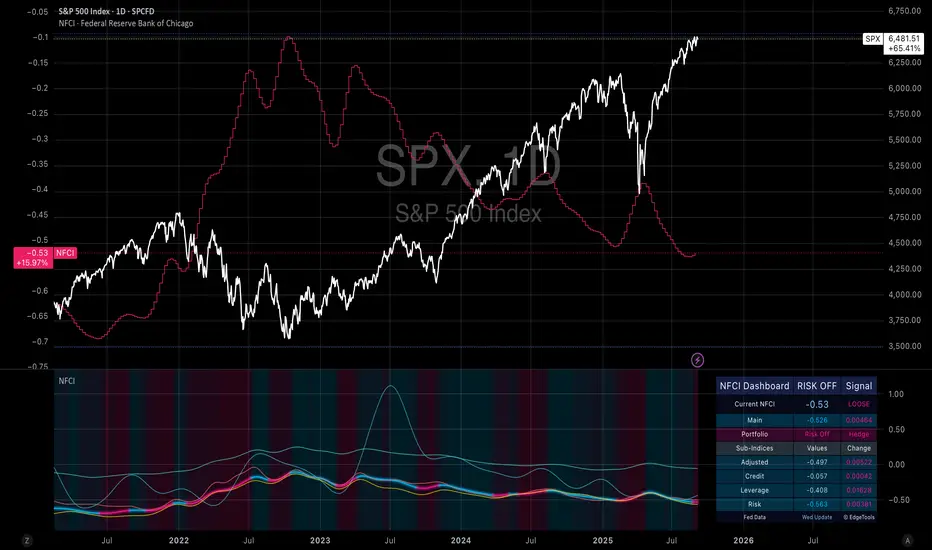
THE FED'S SECRET INDICATOR JUST FLASHED REDHERE'S WHAT IT MEANS FOR YOUR PORTFOLIO
The National Financial Conditions Index from the Chicago Federal Reserve has sent a clear signal this week: financial market conditions are deteriorating. After months of relative calm at a level of -0.53, the index rose on Wednesday, triggering the first "Risk Off" signal in an extended period. For institutional investors and risk-conscious traders, this is a moment that deserves attention.
The NFCI is not just another technical indicator. It represents the most comprehensive assessment of American financial market conditions available. Over 100 different data points flow into its calculation: from credit conditions to volatility measures to banking sector stress indicators. When this index rises, it means liquidity conditions are deteriorating, credit risks are increasing, and financial market stability is under pressure.
The historical evidence is clear. Both in 2008 and 2020, NFCI increases warned weeks before major market crashes of deteriorating conditions. The strategy of building defensive positions during NFCI rises has proven its effectiveness over long periods. While it doesn't deliver the spectacular returns of a pure buy-and-hold approach, it offers something far more valuable: capital protection in critical moments.
BASE CASE SCENARIO
Our base case assumes that the current NFCI rise marks the beginning of a typical correction phase. Historical data shows that such signals typically anticipate market declines of 10 to 15 percent over a period of three to six months. The correction would be driven by a combination of tighter credit conditions, increased volatility, and diminishing investor risk appetite.
In this scenario, we expect the S&P 500 to retreat from its current level of approximately 6,470 points to a level between 5,500 and 5,800 points. This would correspond to a decline of about 10 to 15 percent, equivalent to a normal, healthy correction in an otherwise intact bull market. Recovery would begin once the NFCI starts falling again, signaling that financial market conditions are relaxing.
This scenario is supported by the fact that the American economy remains fundamentally robust. Unemployment is low, corporate earnings continue to grow, and the Federal Reserve still has room for monetary policy support. A moderate decline would correct overvalued areas of the market without triggering a systemic crisis.
WORST CASE SCENARIO
The more pessimistic scenario considers the possibility that the current NFCI rise is the beginning of a more serious financial market disruption. In this case, the index could continue deteriorating and reach values historically associated with genuine financial crises. A sustained rise over several weeks, especially if the NFCI reaches positive values, would indicate systemic problems.
In this scenario, we would have to expect a market decline of 25 to 40 percent extending over 12 to 18 months. The S&P 500 would fall to levels between 3,900 and 4,900 points in this case. Such movements typically arise from a combination of credit squeeze, liquidity shortages, and self-reinforcing selling spirals.
The triggers for such a scenario could be diverse: an unexpected escalation of the geopolitical situation, the bursting of a speculation bubble in an important market segment, or a revaluation of credit risks in the banking sector. The worst-case scenario would also mean that the Federal Reserve would have to respond with aggressive measures, which in turn could lead to longer-term structural changes in monetary policy.
POSITIONING STRATEGY
Given these scenarios, a graduated defense strategy is appropriate. The first line of defense consists of reducing existing long positions and taking profits. This is particularly important for overvalued growth stocks that suffer disproportionately in correction phases.
The second stage involves building direct hedging positions. Put options on the S&P 500 with maturities of three to six months offer cost-effective protection against larger declines. Strike prices between 10 and 20 percent below the current market level should be chosen to achieve a balanced ratio between costs and protective effect.
For more aggressive traders, direct short positions are also available, but with strict risk management. Short positions should not exceed 5 to 10 percent of the total portfolio and must be closed immediately upon a reversal of the NFCI signal.
TIMING AND EXIT STRATEGY
Timing is crucial for NFCI-based strategies. The index is updated only once weekly, meaning signals don't immediately react to daily market movements. However, this is a feature, not a bug. The weekly frequency filters out market noise and focuses on substantial changes in financial market conditions.
The exit strategy is as important as the entry. As soon as the NFCI begins falling again, defensive positions should be gradually reduced. A decline of the index below its previous low would represent a clear "Risk On" signal and justify building new long positions.
It's particularly important not to try to catch the absolute bottom. The NFCI strategy is designed to capture the big moves, not to trade every small fluctuation. Patience and discipline are more important here than precision.
The current NFCI rise is a warning signal that should be taken seriously. While we cannot predict with certainty whether we are at the beginning of a small correction or a larger bear market, the historical evidence justifies defensive positioning. The combination of profit-taking, hedging strategies, and increased liquidity provides the best possible protection against the uncertainties that may lie ahead.
At a time when many investors are blinded by ongoing market euphoria, the NFCI reminds us that markets are cyclical and that caution is often the better part of valor. Those who position defensively today will have the flexibility tomorrow to act from a position of strength when better opportunities arise again.
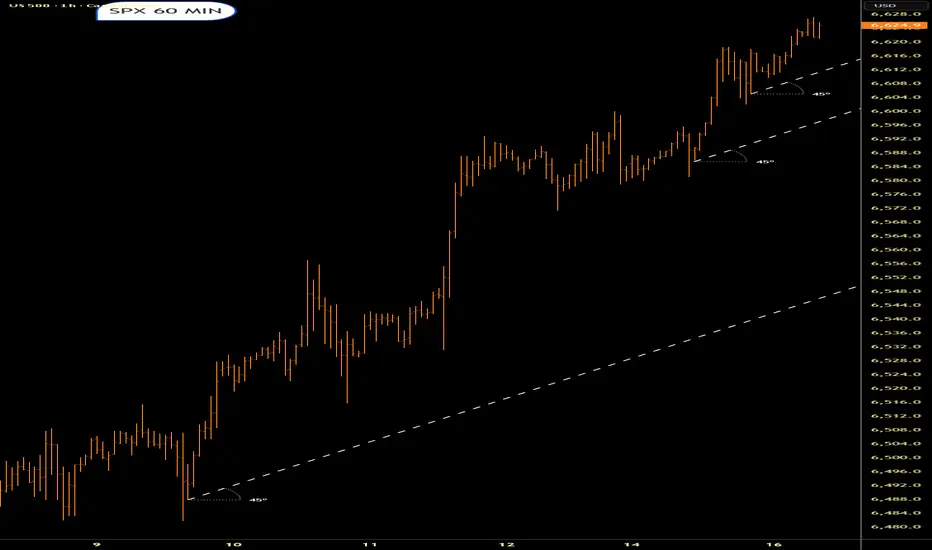
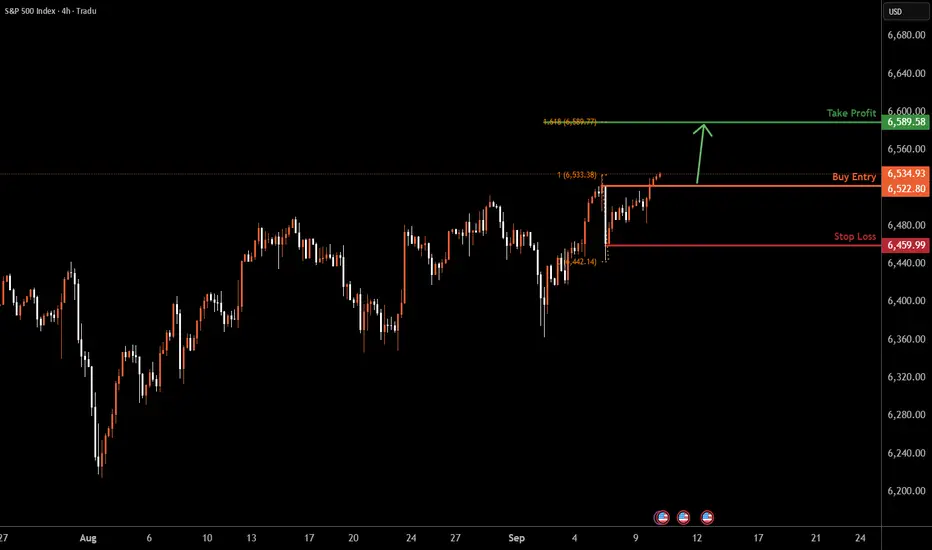
SPX500 H4 | Bullish continuationBased on the H4 chart analysis, we can see that the price has reacted off the buy entry which is a pullback support and could potentially rise from this level to the upside.
Buy entry is at 6,535.17, which is a pullback support.
Stop loss is at 6,459.99, which is a pullback support.
Take profit is at 6,589.58, which lines up with the 161.8% Fibonacci extension.
High Risk Investment Warning
Trading Forex/CFDs on margin carries a high level of risk and may not be suitable for all investors. Leverage can work against you.
Stratos Markets Limited (tradu.com ):
CFDs are complex instruments and come with a high risk of losing money rapidly due to leverage. 65% of retail investor accounts lose money when trading CFDs with this provider. You should consider whether you understand how CFDs work and whether you can afford to take the high risk of losing your money.
Stratos Europe Ltd (tradu.com ):
CFDs are complex instruments and come with a high risk of losing money rapidly due to leverage. 66% of retail investor accounts lose money when trading CFDs with this provider. You should consider whether you understand how CFDs work and whether you can afford to take the high risk of losing your money.
Stratos Global LLC (tradu.com ):
Losses can exceed deposits.
Please be advised that the information presented on TradingView is provided to Tradu (‘Company’, ‘we’) by a third-party provider (‘TFA Global Pte Ltd’). Please be reminded that you are solely responsible for the trading decisions on your account. There is a very high degree of risk involved in trading. Any information and/or content is intended entirely for research, educational and informational purposes only and does not constitute investment or consultation advice or investment strategy. The information is not tailored to the investment needs of any specific person and therefore does not involve a consideration of any of the investment objectives, financial situation or needs of any viewer that may receive it. Kindly also note that past performance is not a reliable indicator of future results. Actual results may differ materially from those anticipated in forward-looking or past performance statements. We assume no liability as to the accuracy or completeness of any of the information and/or content provided herein and the Company cannot be held responsible for any omission, mistake nor for any loss or damage including without limitation to any loss of profit which may arise from reliance on any information supplied by TFA Global Pte Ltd.
The speaker(s) is neither an employee, agent nor representative of Tradu and is therefore acting independently. The opinions given are their own, constitute general market commentary, and do not constitute the opinion or advice of Tradu or any form of personal or investment advice. Tradu neither endorses nor guarantees offerings of third-party speakers, nor is Tradu responsible for the content, veracity or opinions of third-party speakers, presenters or participants.
Precious metals bull market starting pointLot's of similar charts aligning. We are right at the decision point. Will it be like "false start" 2016 or summer 2020? Or will it be more like 1976 or 2000??
If it's like 1976 or 2000, that means the bull market for precious metals and precious metals miners, in real terms, is just beginning.
We'll find out soon!

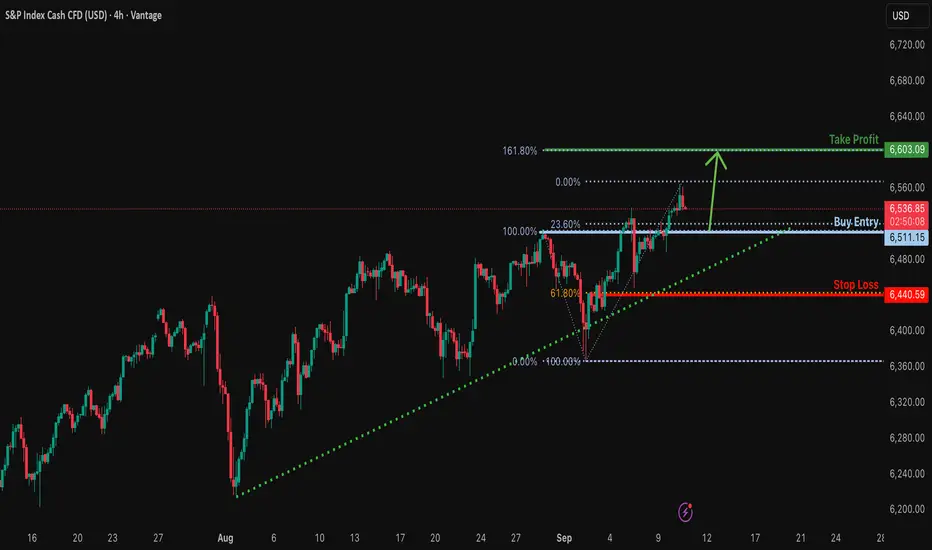
Bullish continuation setup?S&P500 is falling towards the support level, which is a pullback support that aligns with the 23.6% Fibonacci retracement and could bounce from this level to our take profit.
Entry: 6,511.15
Why we like it:
There is a pullback support that aligns with the 23.6% Fibonacci retracement.
Stop loss: 6,440.59
Why we like it:
There is a pullback support that aligns with the 61.8% Fibonacci retracement.
Take profit: 6,603.09
Why we like it:
There is a resistance level at the 161.8% Fibonacci extension.
Enjoying your TradingView experience? Review us!
Please be advised that the information presented on TradingView is provided to Vantage (‘Vantage Global Limited’, ‘we’) by a third-party provider (‘Everest Fortune Group’). Please be reminded that you are solely responsible for the trading decisions on your account. There is a very high degree of risk involved in trading. Any information and/or content is intended entirely for research, educational and informational purposes only and does not constitute investment or consultation advice or investment strategy. The information is not tailored to the investment needs of any specific person and therefore does not involve a consideration of any of the investment objectives, financial situation or needs of any viewer that may receive it. Kindly also note that past performance is not a reliable indicator of future results. Actual results may differ materially from those anticipated in forward-looking or past performance statements. We assume no liability as to the accuracy or completeness of any of the information and/or content provided herein and the Company cannot be held responsible for any omission, mistake nor for any loss or damage including without limitation to any loss of profit which may arise from reliance on any information supplied by Everest Fortune Group.
SPX500 Holds Below 6,590 Pivot – Key Breakout Levels AheadSPX500 – Overview
The S&P 500 is showing bullish momentum but remains sensitive to the 6,590 pivot for confirmation of the next move.
📉 Bearish scenario: As long as price trades below 6,590, momentum favors a drop toward 6,571. A confirmed break under 6,571 would open the way to 6,550 → 6,527.
📈 Bullish scenario: A 1H close above 6,590 would shift bias bullish, targeting 6,604 → 6,631.
Key Level
Pivot: 6,590
Resistance: 6,604 – 6,631
Support: 6,571 – 6,550 – 6,527

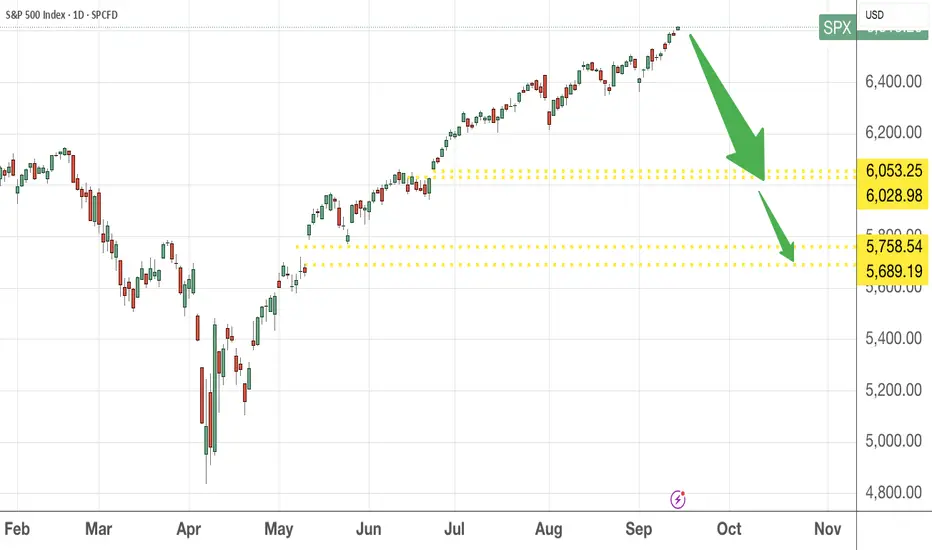
What to do now that FEDs going to lower interest rates ?This is for traders who enjoys taking advantage of short term market movements. For investors who are holding on to great companies, just sit tight.
The first support level is the gap at 6023 price level. The 2nd level at 5689 is less likely but not impossible.
This fall will be good as US markets are over valued for a while and any falls will be a good accumulation point. Also, the month of September is also seasonally a down month so no hurry to get in. So do be patient and please DYODD.
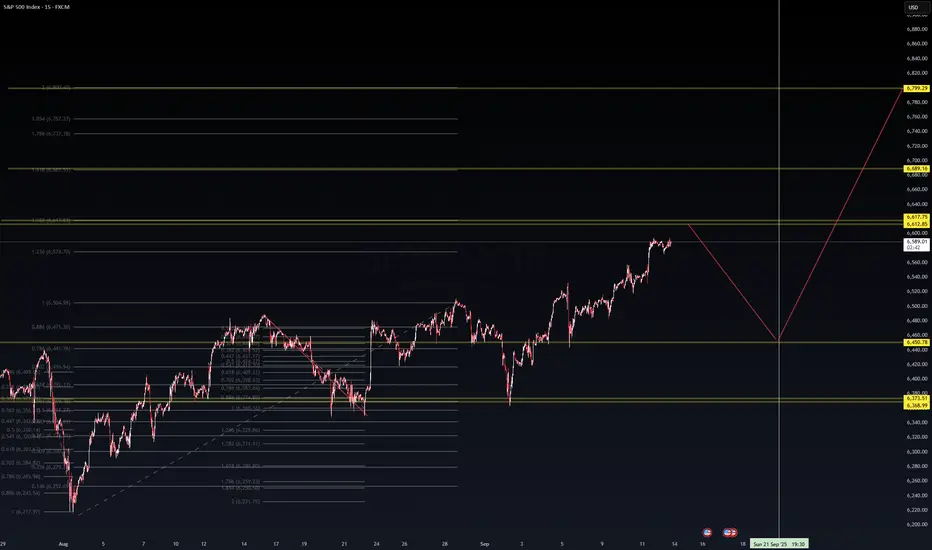
SPX500 (15m) | VolanX Protocol Analysis📊 SPX500 (15m) | VolanX Protocol Analysis
The index is pressing into the 6,617 zone, showing exhaustion at key Fib extensions.
Our VolanX model outlines two possible paths:
1️⃣ A corrective retracement toward 6,450 support before momentum rebuilds.
2️⃣ A continuation breakout, with upside targets at 6,689 and potentially 6,799.
⚖️ Bias: Neutral-to-bullish short-term, with risk of a healthy pullback before continuation.
🧠 VolanX Protocol continues monitoring momentum shifts, liquidity sweeps, and volatility clusters for adaptive trade execution.
🔗 #VolanXProtocol #WaverVanir #SPX500 #TradingAI #MarketIntelligence