Live stream - Forex Market Analysis (28th March)I host daily Pre-London live forex market analysis sessions to guide and educate you through the daily process of trading. I look at the major currency pairs and Gold. I will also analyze other pairs or instruments based on request from the audience.
SPIUSD trade ideas

Live stream - Indices Up Again, USD Is Still On Hold - Daily PitNikkei225, China50, ASX200, DJIA, S&P500, Nasdaq100, DAX40, FTSE100, DXY, Gold, Silver, WTI Oil, NatGas, Cocoa, Wheat, Bitcoin, Ethereum, Litecoin, Ripple, AUDUSD, NZDUSD, NZDJPY, USDJPY, USDCAD, USDCHF, GBPUSD, EURJPY, EURGBP, EURUSD.

Live stream - Fibonacci Masterclass (2/2): Expansions and Projec- What are Fibonacci expansions and projections?
- How are they different from each other?
- How do you use them to forecast market reversals?
- Combining them with retracements and extensions
- Live trading examples

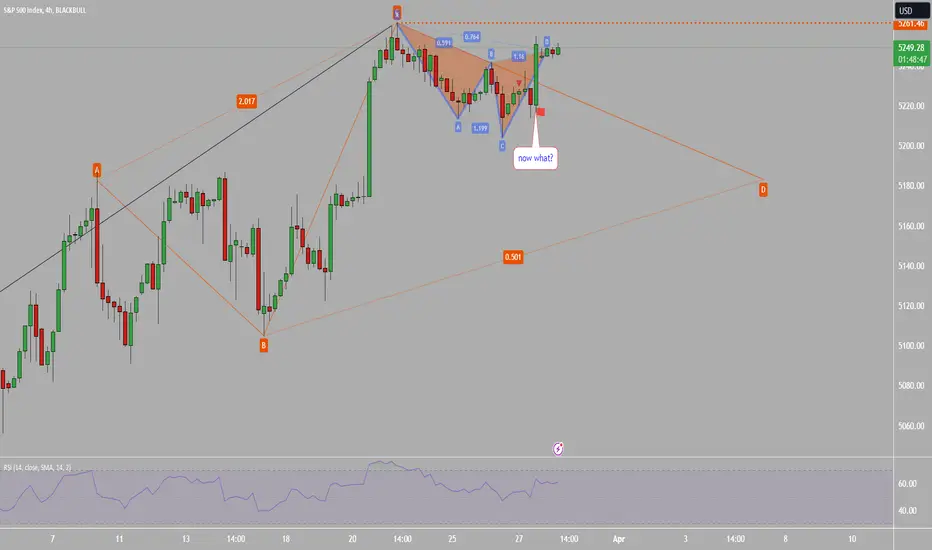
#SPX 260 Now what?Lets see how they kick the can down the road today on my birthday.
3 pm as expected yesterday to complete cypher
SPX500BUY ⚔️
Thank you, Mr. President Trump for pushing up the market
it's gonna lead the ship for the next profit do to the geo movement .

Could price reverse from the swing high resistance?Price is currently at the swing high resistance and could potentially reversal from this level to our take profit
Entry: 5258.22
Why we like it:
There is a swing high resistance
Stop loss: 5280.19
Why we like it:
There is an alignment with the 127.20% Fibonacci retracement
Take profit: 5218.49
Why we like it:
There is a pullback support and also aligns with the ascending trendline support
Please be advised that the information presented on TradingView is provided to Vantage (‘Vantage Global Limited’, ‘we’) by a third-party provider (‘Everest Fortune Group’). Please be reminded that you are solely responsible for the trading decisions on your account. There is a very high degree of risk involved in trading. Any information and/or content is intended entirely for research, educational and informational purposes only and does not constitute investment or consultation advice or investment strategy. The information is not tailored to the investment needs of any specific person and therefore does not involve a consideration of any of the investment objectives, financial situation or needs of any viewer that may receive it. Kindly also note that past performance is not a reliable indicator of future results. Actual results may differ materially from those anticipated in forward-looking or past performance statements. We assume no liability as to the accuracy or completeness of any of the information and/or content provided herein and the Company cannot be held responsible for any omission, mistake nor for any loss or damage including without limitation to any loss of profit which may arise from reliance on any information supplied by Everest Fortune Group.

$SPX Analysis, Key Levels & Targets for GDP SP:SPX Analysis, Key Levels & Targets for GDP
Alright, y’all… WOW, what a crazy move to end the day today…. It totally blew through the top of the trading range.
Tomorrow’s Trading range does have ATH’s in it. We also have GDP in premarket, PCE on Friday as well as Jerome Powell speaking on the last day of the quarter.
Should be an interesting last two days of the quarter.
Don’t forget to take profits when you’re up!!

SP500 Market Rise Is this a good time to buy the SP500 SP:SPX ?
last week was the federal reserve meeting and so investors where
in a mode of doubt
--
Next i believe towards the end of April we might meet a big swing
on the upside of the stock market
But sadly we are in bad economic times, even as oil prices go up,
this is the time to invest in something you believe will make you money
its not easy to find good investments thats why getting a financial education
is one of the most important things for you right now.
When you look at this chart compare it on the ADX, what type of trend
do you think this is?
Do you know how to read the ADX indicator? If yes then good for you
if no then take a look at how to use the ADX indicator
Also learn the rocket booster strategy
Check out the reasources below to learn more.
Disclaimer: This is not financial advice you will lose money from trading please learn rick management

S&P on the riseChart for S&P is trending bullish. This could be a good time to jump on the bandwagon.

Live stream - Market Review 27/03/2014Market Review
Futures: Oil, NQ, ES, Dow
Crypto: BTC, ETH, LTC, ADA, XRP, APT

Big rising wedge, keep an eye on the March 31st (Q1) Close!Post Market Close Update (3/27/24): SPX & VIX Analysis 📉 Join us as we dive into the latest insights on the SPX movement and VIX trends. Is market manipulation at play?
I believe we will be suppressed on the VIX under 16 through the end of the year due to shady democratic loose money actions before this thing truly lets out, sketchy incentives to only care about getting re elected at the expense of crumbling our economy when prices get unsustainable (inflation!)

Performance return since peak-to-trough decline 5 % and more...Performance return since peak-to-trough decline 5 % of price and
Performance return since touching the 20 Day EMA in price...

Live stream - Dive into the excitement of real-time trading and Customize your market experience with us! While we specialize in futures, we're here to dive into the thrilling worlds of Crypto, ETFs, Equities, Bonds, or any other market that piques your interest. Just ask!

Live stream - No Noiz 362 - 3.27.24Live Market analysis Mon, Wed and Fri mornings. Crypto, stonks, commodities and more.

US500 Flag broken with strong bullish candle US500 it's been rising since late October.
March 20, after a strong candle without a lower shadow, the RSI started showing us an extreme level of overbought signal, and US500 price made a flag pattern.
Today after the RSI being again in the middle level made again a similar candle almost without a lower wick, broking the flag.
With this, we can see again the RSI below the extreme zone, but above the middle one, following by today's candle that shows strong emotions testing the resitance


Live stream - Step into the heart of real-time action with our lBe part of the action at 9:15 AM! We achieved our goal 85.11% of 2023 in the first 30 minutes from the market open. Dive in and seize the opportunity! Join our live trading session where we'll trade in the live stream until we reach our goal!


S&P 500-time to be cautious?Even in a holiday-shortened week, with little in the way of data, the path of least resistance remains upwards for US equities. The economic backdrop is generally favourable. The US economy is growing at a faster rate than expected, unemployment remains low and the understanding is that interest rates have peaked, even if the timing of future rate cuts remains uncertain, due to the recent uptick in inflation. Against this all is the belief that US stocks are overbought. Certainly, the major indices have rallied a long way in a very short space of time. But this fact is in itself why many believe that there’s still room to the upside. Quite simply, there are still many investors who have felt unable to take on enough long-side exposure to benefit from the rally which began in late October. The relentless nature of the rally, given the absolute lack of any significant pullback since its start, have left many would-be investors stranded and frustrated. There’s been very little selling pressure which has meant that buyers are having to pay up. And as more investors close their eyes, hold their noses and dive in, prices should continue to melt up. This will go on for as long as it will, until we hit the inevitable barrier, which no one can currently see. Once that it hit, there will be an unseemly rush for the exits.
For now, with the S&P holding over 5,200, there’s no indication that we are about to see a significant pullback. But as the daily chart shows, prices have broken above the upper channel line of resistance which suggests we’re experiencing the kind of melt-up that often signals that a rally is coming to an end. This could be a time to be cautious, especially as the MACD is flattening out a touch.

Spx500 long. Liquidity Phase, 5min entry (Tier one. Rating B+)Enter after MS to complete Liq Phase. Stop below the low of Liq Grab. RR: 1 to 1

Swing Mapping Part 1: Key Principles
Welcome to the first instalment of our 3-part series on swing mapping – a highly underestimated technique that can be applied to any market on any timeframe.
In Swing Mapping Part 1: Key Principles you will learn:
Why it’s the bedrock of all market structure analysis
How to swing map in four simple steps
Why it’s so important to do it yourself rather than use an automated tool
Other key benefits of swing mapping
What is Swing Mapping?
As the name suggests, swing mapping involves identifying swings within market structure to understand the dynamics of price movement.
This may seem too simple to be of much real-world value, but as is often the case in trade, seemingly simple and robust tools can be highly effective and highly nuanced.
When done correctly on a real-time forward-looking basis, swing mapping has the potential to be integrated into many different trading strategies.
Defining a Swing
A swing is simply an uninterrupted high or low. At its core a swing is a three-bar sequence in which the middle bar represents a turning point in the market.
Past performance is not a reliable indicator of future results
Not all swings are equal. The more bars either side of the swing high or low, the larger the peak or trough in the market – the more significant the turning point.
Swings are the bedrock of all market structure analysis. Swings define support and resistance, they define if a market is trending higher or lower, they define if a market is in a range, and they help to define if volatility is contracting or expanding.
Swing Mapping in Action
Swing mapping is at its most useful when it’s conducted in real-time on a bar-by-bar basis. For the purposes of outlining the method, we will use the 1min candle chart and map every potential swing.
Swing mapping is a 4-step forward looking process:
Identify Swing: Identify a swing using the definition provided above (a three-bar sequence in which the middle bar represents a turning point in the market).
Past performance is not a reliable indicator of future results
Draw Market Structure Line: Once a swing is identified draw a solid horizontal line on your chart. The line remains solid until the market has broken and closed above it.
Past performance is not a reliable indicator of future results
Monitor Response: Should the market break through the solid line you have drawn, change the style of line from solid to dotted. If the market fails to break through your line, keep it on you chart as a solid line for as long as you deem to be valid.
Past performance is not a reliable indicator of future results
Past performance is not a reliable indicator of future results
Draw conclusions: Once you’ve repeated steps 1-3 on your chosen trading timeframe, you can then draw important conclusions regarding the market’s current structure.
In our example (below), we followed the S&P 500 as it failed to break to new highs for the day then briefly started to trend lower before moving higher to retest the swing highs which has clustered to form a clear resistance level.
Past performance is not a reliable indicator of future results
Here are just some of the other insights we can gather from mapping swings:
Market Bias: Swing mapping allows you to quickly see where the balance of power lies.
A sequence of dotted swing high lines indicates that the market is consistently breaking to new highs on the day – signalling a bullish bias. Conversely, if a sequence of dotted swing low lines form, then the market has been consistently breaking to new lows – signalling a bearish bias. And finally, if we start to see full lines for both swing highs and swing lows, this signals that a range is developing.
Failure Tests: Failure to break through a swing high or low is the first sign that the market’s current momentum is changing and a new turning point is potentially in place.
In our prior examples we saw a small failure test which led to a pullback, here’s the same chart again:
Past performance is not a reliable indicator of future results
Trend Health: As an uptrend starts to wane, the distance from swing high to swing high tends to shorten. The opposite is true of downtrends. Swing mapping is a great way to identify the health of a trend.
As you become better at swing mapping, you will become more adept at recognising the subtle changes in market structure.
Past performance is not a reliable indicator of future results
DIY - Do it Yourself
There are many tools on the Trading View platform that can do swing mapping for you in real time set to your parameters.
However, to maximise the benefits of swing mapping it is highly recommended that you do this process manually yourself as it will quickly build intuition and rapidly improve your knowledge of market structure.
Drawing the swing lines, waiting for the market to break them and turning them dotted if broken, drawing conclusions as you build a map of broken and unbroken swings, deciding how long to keep unbroken turning point lines solid and valid on your chart. These are all hugely powerful active learning tasks that have the potential to make you a much better trader.
Other Benefits of Swing Mapping
Any Market Any Timeframe: Versatile across diverse markets and timeframes, enabling rapid skill acquisition.
Real-Time Analysis Without Lag: Provides immediate insights into market structure and price action, facilitating timely decision-making.
Enhanced Trade Timing: Identifying responses to market swings in real-time optimises trade entries and exits, maximizing profit potential.
Effective Risk Management: Precisely identifies support and resistance levels, aiding in strategic placement of stop-loss orders and risk assessment.
Adaptability Across Market Conditions: Versatility to adapt to various market conditions ensures consistent performance.
Development of Trading Discipline: Fosters discipline and patience, promoting adherence to predefined rules and strategies.
In Swing Mapping Part 2, we delve into precise trade entry techniques leveraging swing mapping without additional indicators.
Disclaimer: This is for information and learning purposes only. The information provided does not constitute investment advice nor take into account the individual financial circumstances or objectives of any investor. Any information that may be provided relating to past performance is not a reliable indicator of future results or performance. Social media channels are not relevant for UK residents.
Spread bets and CFDs are complex instruments and come with a high risk of losing money rapidly due to leverage. 84.01% of retail investor accounts lose money when trading spread bets and CFDs with this provider. You should consider whether you understand how spread bets and CFDs work and whether you can afford to take the high risk of losing your money.

trillion dollar parallel channel price is rising inside a parallel channel
once channel breaks everything will change instantly

Bulls and Bears zone for 03-27-2024Four straight down days and S&P 500 closing at its Low yesterday does not bode well for the Bulls. If today closes at its Low again then we could get a pullback.
Level to watch: 5290 --- 5292
