SPX is going short on the 10-minute chart analysis, I used fib and it's looking like there is a start for a correcting wave i don't know if it will happen but that seems the case for me.
SPIUSD trade ideas

SPX rising wedge into electionsClear rising wedge here supporting a slow summer meltup continuation into 5555-5638 area before election / breakdown before election
Plan is to play the wedge for continued upside into 5555+
Will flip short if 5179 is lost. If 5179 falls then a short to 4750-4820 begins.

S&P 500 Daily Chart Analysis For Week of June 7, 2024Technical Analysis and Outlook:
In this week's trading, the S&P 500 hit our anticipated resistance level of 5323 and retested the completed Outer Index Rally of 5342. The index is prone to drop to Mean Sup 5325 and possibly to the next level of Mean Sup 5285 before continuing its journey to the next Inner Index Rally 5408.

S&P IS Ready To Complete Impulsive WavesThe 4hr time frame of S&P 500 chart shows a healthy bullish trend line. IT has completed the forth wave and is ready to complete the fifth. The targets are:
1. 5400
2. 5450
3. 550

Dopamine rules the world I guess you heard about dopamine... and the only thing dopamine loves is more dopamine...
In the graph below you can see how dopamine spikes work based on the new Dopamine celebrity mr Huberman
tacticsplus.com
So how the party started how it's going and how it might end.
1) Everything started with the Covid outbreak
2) Then the FED started buying financial assets
3) Government handed out free money to everyone
4) We had the first stage of the party where the majority of people havehad never played this game before (dopamine loves new dopamine sources aka the unexpected) and that's how we wen to Fun 1 phase, think of it as someone who has never drink and this was the first time he went onto a party and got drunk... and he liked it because it was something completely new in terms of dopamine rush
5)The next day (year) we had the return to the baseline happiness but quite above from where it started but hey what we said? dopamine loves dopamine and dopamine does not care where you get your dopamine from it only cares about MORE DOPAMINE
6)Now we are going again to the party but this time the amount dopamine we need to get to the same high or above is much higher...
7) we are waiting to see how it will work out
What i understand from my small experience in markets is the following : markets love to move in the point of MAX PAIN and most of the money are lost in HYPERBOLAS why?
1) Shorts get squeezed forced to close their positions
2) Longs have FOMO and jump in the party at the very worst moment
In that was both longs and shorts are losing... but hey who is winning?
1) Those who bought the return to baseline
2) Those who did not short yet and waited for the fun part 2
So in others terms whether you are a long player or short the key is to go contrarian from popular belief and be patient...
ALL OF THE ABOVE ARE 101% IN MY IMAGINATION! THIS IS NOT AN INVESTMENT ADVICE JUST SOME PHILOSOPHICAL THOUGHTS I WANTED TO SHARE. PLEASE DO YOUR OWN RESEARCH AND NEVER FOLLOW OTHER PEOPLE'S ADVICE BLINDLY.

Weekly Market Wrap With Gary Thomson: 3 - 7 JuneWeekly Market Wrap With Gary Thomson: S&P 500, US Dollar, Gold and Silver, MSFT Shares
Get the latest scoop on the week's hottest headlines, all in one convenient video. Join Gary Thomson, the COO of FXOpen UK, as he breaks down the most significant news reports and shares his expert insights.
- S&P 500 Index: Latest Analysts’ Forecasts
- The Dollar Continues Range-Bound Trading Ahead of US Employment Data
- The Price of Silver Is Acting Weaker Than Gold
- MSFT Shares Surge on Record Yearly Volumes
Stay in the know and empower yourself with our short, yet power-packed video. Watch it now and stay updated with FXOpen. Don't miss out on this invaluable opportunity to sharpen your trading skills and make informed decisions.
🌐 FXOpen official website: www.fxopen.com
CFDs are complex instruments and come with a high risk of losing your money.

US500RSI indicates Bearish Divergence. Which means that at any time the market trend can change to LL and LH.

SPX - Summer of painSPX has topped on a weekly timeframe and should give a ~10% drop. Now, it is highly likely that we are also seeing a top of much higher degree from '08 lows, but will judge that for later. Step by step. SP:SPX

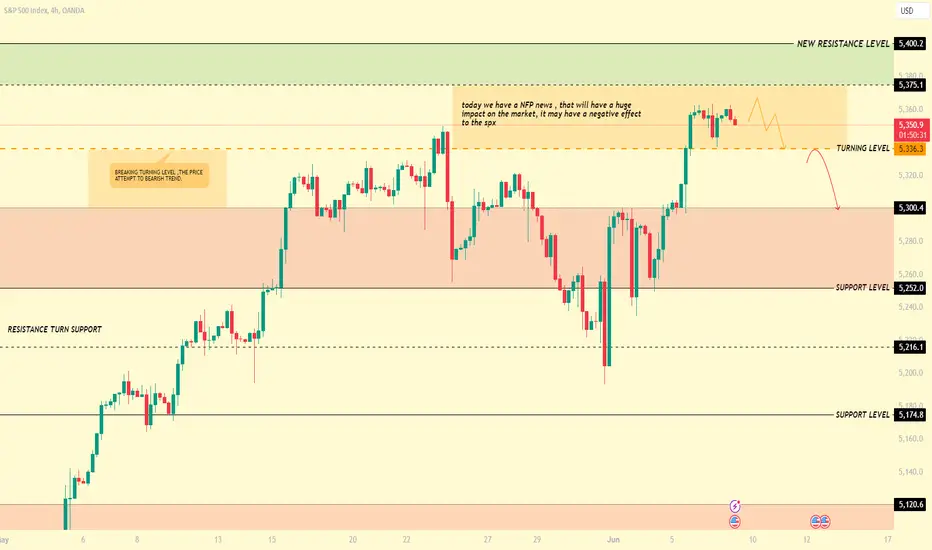
SPX500USD ( EFFECT NFP )SPX500USD
Tendency the price effect downward pressure
Turning level : The turning 5,336, so as long as the price trending above this level, there will be a bullish trend , but breaking this level the price it comes down ward pressure
resistance level : trade above 5,336 , the price will up to 5,375, then trending in this level touch a 5,400
support level : braking a turning level 5,336 ,the price will reach the support level of
5,300 and 5,252
* today we have a NFP , news I urge the trader to trading very carefully
SPx (Correction after rally or finished) Technical Analysis of SPx
the price will move under the NFP and the Unemployment rate pressure, so the movement will be huge for the indices.
Bullish Scenario: For a bullish trend to emerge, the price must stabilize above 5260, potentially pushing up to 5302. If the price surpasses this level, it may indicate the start of a new bullish trend of about 5347. but right now as long as the price trades above 5347 means will try to touch 5378 as well.
Bearish Scenario: if the price breaks 5347 means will drop to touch 5320 and then downward should break the support zone which is 5301 to get 5259
Pivot Line: 5347
Resistance Levels: 5378, 5400, 5423
Support Levels: 5320, 5302, 5260
Today’s expected trading range is between the support at 5301 and the resistance at 5423.
Market Concentration Hits Record Levels with Microsoft NASDAQ:MSFT , Nvidia NASDAQ:NVDA , and Apple NASDAQ:AAPL
For the first time since at least 2000, three U.S. stocks—Microsoft Corp., Nvidia Corp., and Apple Inc.—now account for over 20% of the S&P 500's total value, according to Dow Jones Market Data. This means that these three companies alone are worth more than hundreds of other constituents combined, as highlighted by data from Bespoke Investment Group.
Historically, increasing concentration in a few large-cap stocks has often coincided with stronger overall returns for the S&P 500. However, the rapid rise in the values of these tech giants is causing some concern among investors. Even those who have been bullish are starting to feel uneasy about the growing dominance of these few stocks within the index.

S&P 500 faces resistance ahead of crucial data and FOMC meetingThe bullish drive has been revived in US equity indices after a few weeks of downside pressure. The S&P 500 and the Nasdaq both broke to new highs on Wednesday driven mostly by technology stocks. The ADP May employment report also helped revive some buying appetite as it came in below expectations. There isn’t a very good correlation between the ADP data and the non-farm payroll data released later today, but markets took benefit in the weaker reading as a sign of a possible cooling in the US labour market, which could allow the Federal Reserve to cut some time in the coming months.
Money markets are assigning a 97% chance of no change from the central bank when it meets next week. But the ECB’s 25 basis point cut delivered on Thursday may have started to put traders in a better mood when considering the possibility that the Fed will actually be able to cut this year. For now, a 25-basis point rate cut is fully priced in by November, but Powell and his team have continued to be quite hawkish up until now, dampening hopes. Next week’s meeting will be a big test for markets as they’ll want an update on how the central bank expects things to unfold. Before the meeting, we’ll see the CPI data for May, another important market event.
On the chart, the S&P 500 continues to show potential for upside movement, but the rise ascent is becoming more laborious. Thursday saw little movement for the index as traders took a pause ahead of the latest labour data released on Friday. There is likely to be a lot of focus on the wage component of the data, as wage inflation has been sticky in recent months, and a key reason stopping the Federal Reserve from cutting. If the data comes in softer than expected, then it is likely that we see further bullish follow-through in the S&P 500 and other major US indices. That said, the chart continues to show signs of being a bit over-extended so the extent of the move might be slightly limited. Traders will also be weary of the CPI data being released next week so they may want to hold off on being too bullish just yet. The majority of the move is likely to come after the FOMC meeting next Wednesday, especially if the bank starts to show a readiness to cut rates fairly soon.

Possible Buy Scenario for S&P500 todayThis is the buy scenario I'll be considering today.
The chart speaks for itself, but if anyone requires more context I'd be glad to provide it.
Keep it simple.
Trade wisely.

SP500 WILL KEEP RISINGSP500 Is approaching main trend line and looks weak on smaller time frame. I think we will see a long squeeze that will make the price to drop, probably around 5340-5330. At this level i Will look for a long entry that may come later with the NFP. I think we will see new highs next week, after a flash crash

SPX - Mini Futures Given it's all markets factored in - not sure if tech analysis works here but..
Fib extension right? Keep it simple. Quick look at fib extension and levels look respected given support resistance.

US500, support confluence could built bullish momentumWe have a nice confluence of 1H and 4H support at S&P.
I'm entering with a long position to potentially follow to new ATHs, if the market sentiment pick up the trend again.

PARALLEL CHANNEL IDEA $SPXThere are about 3 parallel channels we can find on this chart from log, to auto and even a much larger channel from decades past that all line up to today.
I am using this channel as my first line of Resistance.
Rejecting this channel on the multi year time frame.
Bearish divergence on the weekly / monthly TF.
RSI & MACD have rejected the MA after a retest on the Weekly TF.
Invalidation here is very easy.. You break above this channel and confirm.. You have .4 to .5 % if you are to reach that trend line from here. However, you have quite a few reasons that we could stop and top out here and reject ......
I will post another channel I have later.

Bulls and Bears zone for 06-06-2024S&P has been moving upwards this week and made a New ATH yesterday. Any test of yesterday's Close could provide some direction for today.
Level to watch: 5364 --- 5362

USSPX ( BULLISH TREND PRESSURE )USSPX
Tendency the price is a long in 5,336
Turning level : The turning 5,336, so as long as the price trending above this level, there will be a bullish trend
resistance level : trade above 5,336 , the price will up to 5,375, then trending in this level touch a 5,400
support level : braking a turning level 5,336 ,the price will reach the support level of
5,300 and 5,252
corrective level : price will attempt 5,336 , correct itself before long , then create a new historical price

Nvidia Drives S&P 500 Market Cap Surge with 36% ContributionThe price has reached our target, as mentioned yesterday, with a gain of +1.20%, approximately $60.
The SPX has recorded a new all-time high and continues to gain. It may retest down to 5347 before pushing up to 5378.
Overall, it could potentially reach 5320 if it stabilizes below 5347. As long as it trades above 5320, an uptrend towards 5423 is expected.
Bullish Scenario: If the price trades above 5347, it will continue its bullish trend toward 5378, and above that, it could reach 5423.
Bearish Scenario: If it stabilizes below 5347, it may drop to 5320. Stabilizing below 5320 on a 1-hour candle could lead to a decline to 5301.
Pivot Line: 5347
Resistance Lines: 5378, 5400, 5423
Support Lines: 5320, 5302, 5260
The price is expected to move between the support level of 5320 and the resistance level of 5423.
previous idea:
Nvidia Drives S&P 500 Market Cap Surge with 36% Contribution in 2024
Shares of US-based chipmaker Nvidia Inc. have had a stellar 2024, soaring nearly 150% and reaching new all-time highs. This impressive performance has significantly contributed to the $4.49 trillion (12%) increase in the S&P 500’s market capitalization, which now stands at $47.16 trillion.
Nvidia’s remarkable gains have been a major driving force behind the S&P 500’s record-breaking achievements. The chipmaker's contribution alone accounts for 36% of the index’s market cap surge this year, highlighting its pivotal role in the broader market’s upward trajectory.
In addition to Nvidia's impact, the S&P 500 has been bolstered by favorable economic indicators, including cooling jobs data, which has alleviated some inflationary pressures and supported continued market growth.
As the S&P 500 hits new records, Nvidia's milestone of reaching a $3 trillion market cap underscores the significant influence of leading tech companies in shaping market trends and driving substantial gains across the board.

SPX500, PLAN 05/06After finding a new ATH on Thursday May 23, the price of the S&P500 fell by 3%.
I was a seller at the end of last week and the beginning of this week.
However, we've now reached some interesting levels that could signal a change in trend (CHoCH).
Initially, EQHs will be sought at $5302. But for me, the real CHoCH is at $5326 (the zone where I'll go back to buying).
If we look at the H1 chart, we can see that the price has returned to the OTE zone before starting to rise again.
This supports my idea of a potential return to the upside, and why not back to the ATH...
Feel free to subscribe and boost this post if you enjoyed my analysis, and tell me what you think!
Happy trading and a great week :)

The US500 is very interesting right nowThe index has made the abc correction I expected.
This is a necessary abc drop to start reaching new heights.
One of the most important things to understand when looking to buy various popular stocks. Also applies to Bitcoin.
PS this index is designed to go up forever, at least as long as we exist on this planet. Pure logical thinking.

More All-Time Highs for the Stock MarketI’m just floored that the S&P 500 is well above 5000 and, now, steadily approaching 6000 level. What I find most interesting, is that if you read the average news headline or spend time on the Internet, you'll most likely walk away with a sense of dread i.e. something is wrong somewhere! Or, the world is in shambles. This all seems almost counterintuitive; while many people perceive the world as being in a dire state, the stock market is sending a completely different message. The market appears to be booming, which is a stark contrast to the widespread sentiment.
There is an important lesson in all of this.
First of all, the market's robust performance is supported by several factors that are bigger than any individual economic indicator. For example, technology continues to thrive and create new efficiencies. Obviously AI comes to mind, but under the surface, there is also a brewing interest in new energy sources (fusion energy) and of course other tools like crypto, which is making money even more mobile than it was before. All of this trickles into growth.
The lesson:
This phenomenon highlights a fundamental lesson about the markets that many people struggle to understand, often taking years to fully grasp: price movements can tell you much more than the news. The market speaks, but not everyone is willing to listen.
Warren Buffett once said, "The stock market is designed to transfer money from the Active to the Patient." The S&P 500 hitting all-time highs again today is another reminder of that.

SPX W Long JUN 5 2024Daily - Rejection of 5,257 + continuation to the upside
4h, 1h, 30m - Break/Retest of level
15m - candle rejected but closed above support at 5,300 RN
5m - ENTRY - Break of fakeout top wick candle, signaling continuation to the upside.
Target - 2.5:1RR
Actual - 2.2:1RR
Fundamental - PMI +
