The market still has ample room to grow!Society isn't crumbling yet.... We'll get there sure enough, but as for now, there is still plenty of spoils to be had.
SPIUSD trade ideas

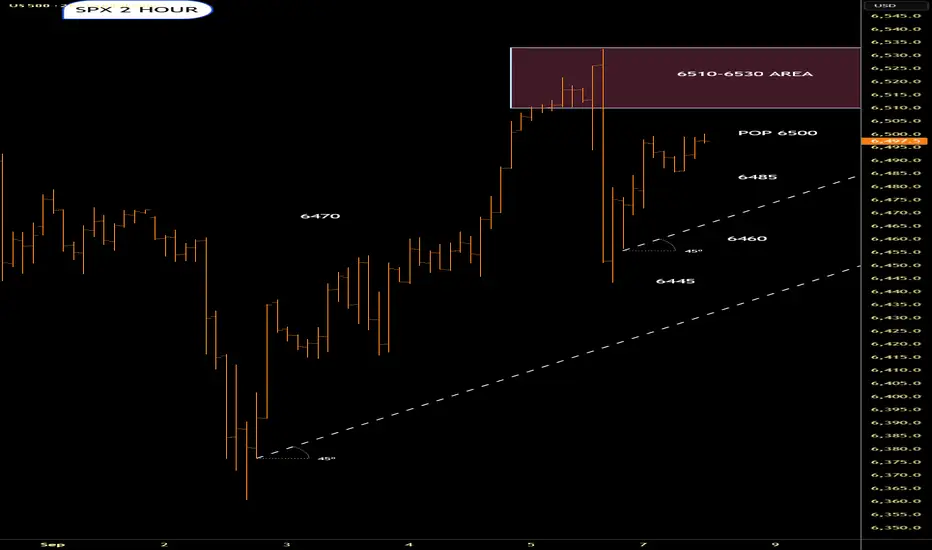
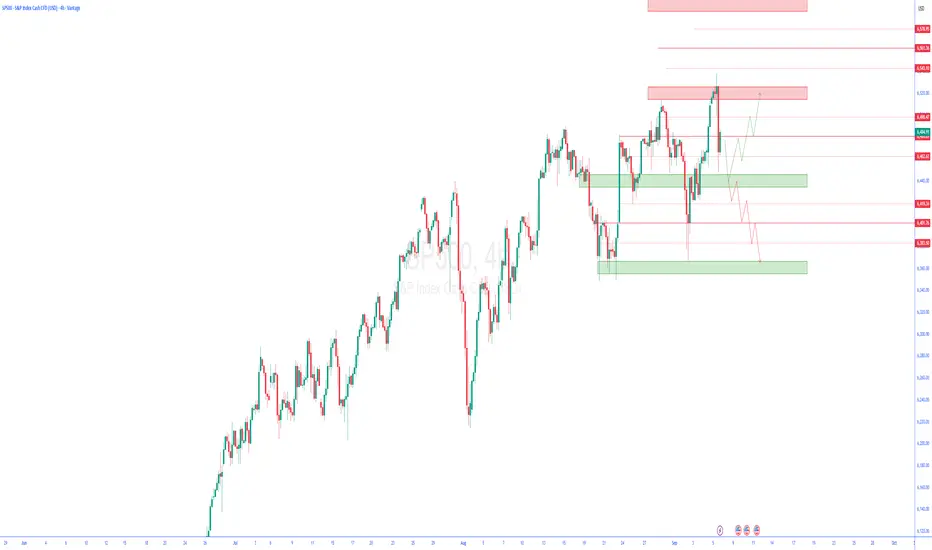
SPX | Buy & Sell Setup | 08 Sep 2025 – 11:05 EDT
SPX | Buy & Sell Setup | 08 Sep 2025 – 11:05 EDT
Buy Zone: 6509– 6490
Sell Zone: 6469 – 6357
Scenario 1 : Buy
Entry: 6510
Stop Loss: 6465
Targets:
TP1 → 6580 (1:5)
Analysis:
From Buy Zone (6509– 6490) creates possibilities for a buy move.
Scenario 2 : Sell
Entry: 6465
Stop Loss: 6510
Targets:
TP1 → 6415
TP2 → 6350
Analysis:
From Sell Zone (6469 – 6357) creates possibilities for a sell move.
Stay alert on updates here.
⚠️ Disclaimer: This idea is shared for educational purposes only and should not be considered financial advice. Please do your own analysis before making trading decisions.

S&P500 | 100 year bullish channel | GTradingMethodHello Traders - Happy Monday!
I thought this was a very interesting perspective on S&P500.
What they don’t want you to see... 👀
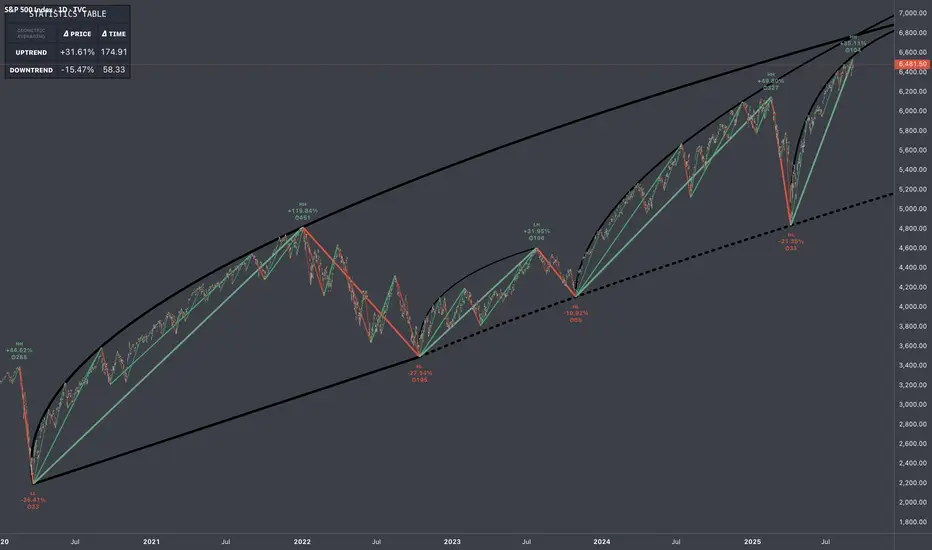
The S&P has been moving inside a bullish channel for nearly 100 years (since 1925).
Right now, price is breaking out of that channel but is it fakeout?
If it’s a fakeout, the implications are huge: we could be looking at a 70% drop back to the bottom of the channel.
⚠️ Chart is on the monthly timeframe with a logarithmic scale.
What do you think — breakout or fakeout? Very keen to hear all your thoughts
#TradingLife

SPX500 Awaits Breakout – Key Levels 6,506 & 6,486SPX500 – Overview
The S&P 500 is holding above the 6,490 pivot, with short-term momentum favoring a retest of 6,506.
Technical Outlook:
📈 Bullish scenario: While above 6,490, price is expected to test 6,506. A confirmed breakout above this level would extend upside toward 6,527 → 6,550.
📉 Bearish scenario: A confirmed 1H close below 6,486 would open the way to 6,469, with further downside toward 6,425 if that level breaks.
Key Levels:
Pivot: 6,490
Resistance: 6,506 – 6,527 – 6,550
Support: 6,469 – 6,453 – 6,425

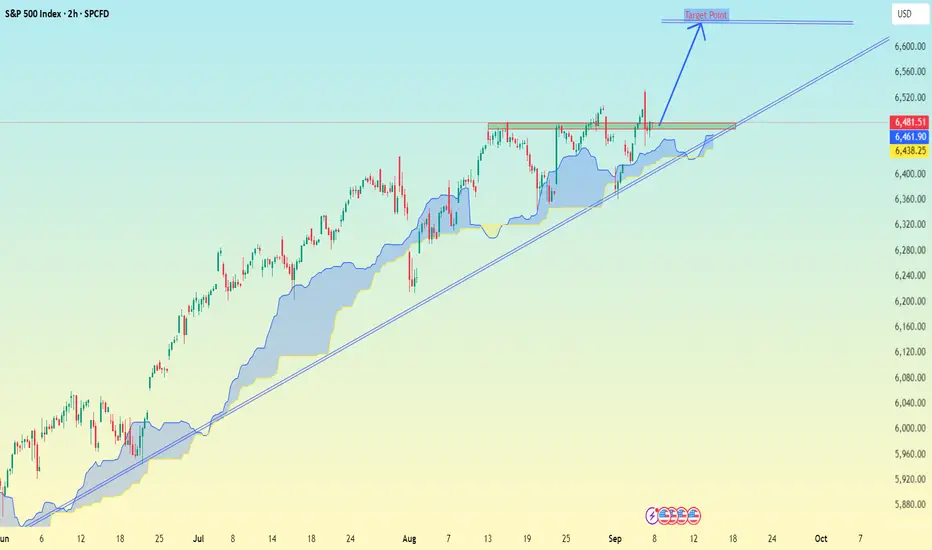
2h timeframe (SPCFD index, looks like US500 / S&P CFD).This is a 2h timeframe (SPCFD index, looks like US500 / S&P CFD).
Current price is around 6,403.
I have drawn a falling trendline from July, and price is now near the lower zone.
There’s also volume profile (VPVR) on the right side, showing key liquidity zones.
A target point is marked below, around the 6,200 level.
📌 Target Zone:
My chart suggests a downside target around 6,200 (highlighted with the blue arrow).
⚠ Notes:
If 6,400 support breaks clearly, sellers may push toward 6,300 → 6,200.
But if price reclaims above 6,480–6,500, the short-term bearish setup could fail, and we may see a bounce.
👉 Immediate target: 6,200
👉 Stop-loss to watch (invalidating short): above 6,500
SP500 Long Setup – Fib Confluence to 6649Watching SP500 on the 1H timeframe for a continuation move higher. Price bounced cleanly from the 6469 zone, which lined up with the Fib 0.236 retrace and EMA support.
Entry taken around 6500 with stop placed below recent swing low at 6442–6439. This keeps risk controlled while protecting against invalidation.
Targets are set using Fibonacci confluence and previous structure levels:
• TP1: 6535 (Fib 1.0 / prior reaction level)
• TP2: 6590 (Fib 1.618 extension)
• TP3: 6649 (range extension target)
If momentum continues, a runner could extend beyond 6649, but the main plan is to secure profits at each ladder.
This trade offers strong risk-to-reward with clear invalidation. I’ll manage the position by locking in profits at TP1 and trailing the remainder.

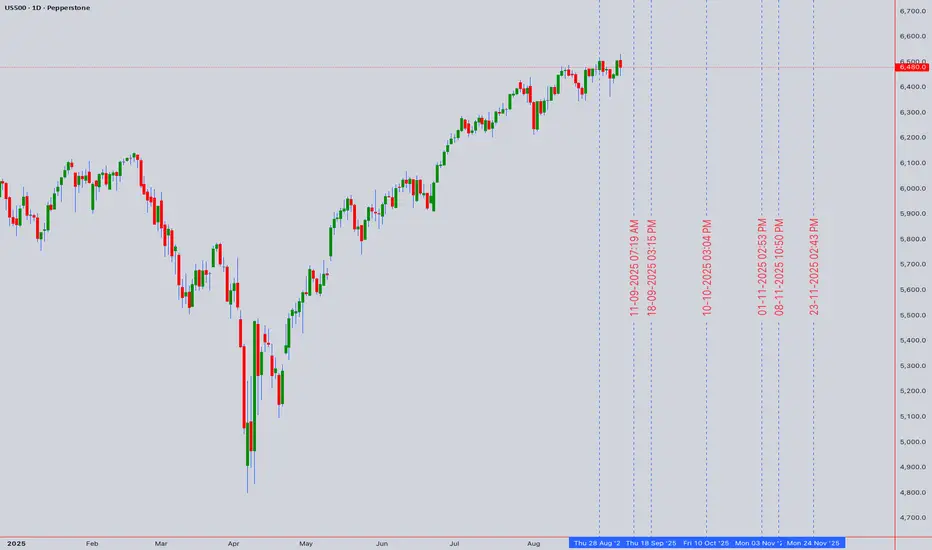
SPX: NVIDIA surging bets on Fed cutThe previous week on the US stock markets was marked with surprisingly low Non-farm payrolls data in August. Namely, only 22K new jobs were added to the US economy, while the market was expecting to see at least 75K. At the same time, unemployment rose to 4,3% in August from 4,2% posted for the previous month. These figures were a game changer when market sentiment is in question, so Friday was a quite volatile day. Namely, during the one day, the positive market sentiment pushed the S&P 500 to the historically highest level at 6.530, but the disappointing jobs data, reverted the optimism, so the index closed the week at 6.481. The slowing jobs market increased expectations that the Fed now has solid grounds to cut interest rates by 25 basis points at their September meeting.
The company Kraft Heinz was in the center of news during the previous week, after the announcement that the company will split into two, in a strategic move aimed at unlocking brand value. The split should finalize in the second half of 2026. Shares of the company rose by 1% on the news, however, it should be considered that the stocks lost around 21% over the past year. Another company that was discussed was Robinhood Markets, which will join the S&P 500 index before trading on September 22nd, in a milestone indicating growing mainstream acceptance of the fintech giant. The stocks of the company surged around 7,3% following the announcement.
Some higher volatility might be expected also in the coming period on the US stock markets. There are still both positive and negative drivers which are shaping market sentiment. In the week ahead the US August inflation data will be posted, which might bring some higher volatility in case that the figures are not in line with market expectations. For the moment, the easing jobs market in the US is providing a strong case for the rate cut in September.

Global Positional TradingWhat is Positional Trading?
Positional trading is a style of trading where positions are held for a longer duration, typically:
Short-term positional trades → A few weeks.
Medium-term positional trades → 1–3 months.
Long-term positional trades → 6 months or more.
The primary goal is to capture big trends rather than small fluctuations. Positional traders look for macro or sectoral themes and align themselves with the direction of the market.
When applied globally, positional trading expands to:
Global stock indices (S&P 500, Nikkei 225, DAX, FTSE 100).
Currencies (EUR/USD, USD/JPY, GBP/USD).
Commodities (gold, crude oil, natural gas, agricultural products).
Bonds and yields (US 10-year, German bunds).
ETFs that track global sectors or regions.
Why Global Positional Trading?
Trading is no longer restricted to national markets. With the rise of online brokerages, access to global markets has become easier. Global positional trading is powerful because:
Diversification of Opportunities
A trader is not limited to domestic equities but can trade across multiple asset classes worldwide.
Example: If US equities are consolidating, opportunities may exist in Japanese equities or crude oil.
Macro Trends Dominate
Global interest rate cycles, inflation, commodity demand, and geopolitical tensions create long-lasting moves.
Example: The Russia-Ukraine war in 2022 caused months-long surges in crude oil and natural gas.
Riding the “Big Waves”
Unlike intraday volatility, positional traders focus on multi-week/month moves.
Example: The US dollar index (DXY) uptrend during 2022 lasted nearly a year.
Time Flexibility
Global positional traders don’t need to watch charts every second.
Analysis can be weekly/monthly, making it more practical for part-time traders.
Core Principles of Global Positional Trading
Trend Following
The core philosophy is: “The trend is your friend.”
Traders identify global macro trends and align with them.
Fundamental & Macro Analysis
Positional trades often rely on fundamental shifts (interest rates, inflation, GDP growth, trade policies).
Technical Confirmation
Long-term charts (daily, weekly, monthly) are used to confirm entries and exits.
Patience and Discipline
Unlike scalpers, positional traders need to hold through volatility to capture the big picture.
Risk Management
Since positions are held longer, stop-loss levels are wider.
Position sizing becomes critical to avoid large drawdowns.
Global Market Instruments for Positional Trading
1. Equity Indices
S&P 500 (USA), Nasdaq, Dow Jones, DAX (Germany), FTSE (UK), Nikkei 225 (Japan), Hang Seng (Hong Kong), Nifty 50 (India).
Example: A trader might go long on S&P 500 if the US economy shows strong earnings growth.
2. Currencies (Forex)
Major pairs: EUR/USD, GBP/USD, USD/JPY, USD/CHF.
Emerging pairs: USD/INR, USD/BRL, USD/ZAR.
Example: If the US Fed raises interest rates while Europe cuts them, traders may hold long USD positions for months.
3. Commodities
Precious metals: Gold, Silver.
Energy: Crude oil, Natural gas.
Agriculture: Soybeans, Wheat, Coffee.
Example: During inflationary phases, gold often trends upward for months.
4. Bonds & Yields
Positional trades can be taken on US Treasury bonds, German bunds, etc.
Example: Rising US yields may lead to a bearish bond trade held for months.
5. ETFs and ADRs
Traders can access international assets through Exchange Traded Funds (ETFs) or American Depository Receipts (ADRs).
Key Strategies in Global Positional Trading
1. Trend Following Strategy
Enter in the direction of the global trend.
Example: Long gold during inflationary environments.
2. Breakout Strategy
Identify consolidations and trade the breakout.
Example: Crude oil breaking above $100 in 2022 after consolidation.
3. Mean Reversion Strategy
Buy oversold assets, sell overbought ones.
Example: A currency pair retracing after extended uptrend.
4. Carry Trade Strategy
Borrow in low-interest currency, invest in high-interest currency.
Example: Short JPY (low rate), long AUD (high rate).
5. Sectoral / Thematic Strategy
Position based on global sector themes.
Example: Renewable energy stocks during global energy transition policies.
Tools for Global Positional Trading
Charting Platforms (TradingView, MetaTrader, Thinkorswim).
Fundamental Data Sources (Bloomberg, Reuters, Investing.com, FRED).
Economic Calendars (To track central bank meetings, GDP, inflation).
Sentiment Indicators (Commitment of Traders report, VIX index).
Risk Management Tools (Position sizing calculators, stop-loss automation).
Time Frames for Global Positional Trading
Weekly charts: Best for identifying major trends.
Daily charts: Fine-tuning entries/exits.
Monthly charts: Macro view for long-term investors.
Risk Management in Global Positional Trading
Use wider stop-loss levels due to longer holding periods.
Allocate 2–5% risk per trade.
Hedge with options/futures if needed.
Diversify across asset classes (stocks + commodities + forex).
Advantages of Global Positional Trading
Capture large, sustained moves.
Lower stress compared to intraday.
Fits part-time traders with limited screen time.
More aligned with fundamentals.
Higher profit potential per trade.
Challenges and Risks
Global Event Risk → Wars, pandemics, trade disputes.
Overnight/Weekend Gaps → Sudden gaps in global markets.
Currency Risk → Holding international positions in foreign currencies.
Patience Required → Trades may take months to play out.
Capital Lock-In → Funds are tied up for long durations.
Examples of Global Positional Trades
Gold during 2020 COVID-19 Crisis
From $1,450 to $2,070 within 5 months.
Positional traders captured nearly 40% upside.
US Dollar Index (DXY) in 2022
Fed rate hikes → USD rallied for 10 months.
Long USD positions were classic positional trades.
Crude Oil after Russia-Ukraine War
Jumped from $70 to $130 within weeks.
Positional long trades yielded massive returns.
Psychology of Global Positional Traders
Patience → Letting the trade develop without closing too early.
Conviction → Believing in the analysis despite short-term volatility.
Adaptability → Switching positions when fundamentals change.
Future of Global Positional Trading
Increasing access via global brokers and apps.
Rising importance of AI-driven analysis for global trends.
Crypto markets adding new positional opportunities.
Geopolitics (US-China trade war, Middle East tensions) making macro trades more relevant.
Conclusion
Global positional trading is about looking beyond short-term noise and focusing on big global trends. It allows traders to participate in long-lasting moves across equities, forex, commodities, and bonds by combining macroeconomic analysis, technical charts, and disciplined risk management.
It requires patience, strong research, and conviction but rewards traders with opportunities to ride the “big waves” of global markets—whether it’s the US dollar’s strength, crude oil surges, or gold’s safe-haven rally.
For traders seeking to diversify, reduce daily stress, and capture significant profits, global positional trading is one of the most effective strategies in today’s interconnected financial world.
Econ: Warning SignsI don't usually cover fundamental landscape unless several key economic indicators and policies paint a picture of emerging trouble.
Jobs market collapse is real
The NFP print of 22K is a disaster, missing estimates by a wide margin.
Revisions are key: June was revised down to -13,000 jobs. This is the first negative print since 2020 and signals the slowdown began months ago.
The U6 rate jumping to 8.1% is a huge red flag. This includes part-time workers who want full-time jobs and those discouraged from looking. It shows significant underlying weakness the headline U3 rate hides.
Tariffs didn't work
The policy was supposed to boost US manufacturing and slash the trade deficit. The opposite is happening.
US Manufacturing PMI has been in contraction for 6 straight months. Why? Tariffs on steel and aluminum have made input costs soar, crippling competitiveness.
The Goods Trade Deficit ballooned 22% in July to $103.6B. Imports rose nearly 6x faster than exports. This is a direct contradiction to the policy's goal and acts as a tax on consumers and businesses.
Stagflation Risk
Weak Growth + Persistent Inflation
Growth is stalling: Weak job creation, falling manufacturing output.
Inflation is sticky: While wages cooled slightly, prices remain high (as confirmed by consumers in Tennessee interviews).
🏛️ The Fed is now trapped. Cutting rates could fuel more inflation. Hiking rates would kill more jobs. There is no good exit.
Tourism: An estimated $80 billion in lost revenue is a massive hit. This has a multiplier effect, hurting local economies far beyond the initial number.
Energy: Cancelling near-complete renewable projects (like the RI wind farm) creates uncertainty and hurts long-term energy capacity planning.
Agriculture: Farmers in Arkansas and elsewhere are facing bankruptcy due to low prices, high costs from tariffs, and labor shortages. This is a repeat of the 2018 bailout scenario.
Three False Narratives:
"The Data is Wrong": Attacking the BLS methodology and promising upward revisions. This is shooting the messenger. The trend across multiple reports is clearly negative.
"Just Wait a Year": Claiming the benefits of the policies are just around the corner. This is a hope-based strategy, not data-driven.
"Look at Private Investment!": Pointing to vague, performative pledges from tech CEOs (like Zuckerberg's hot-mic "$600B" comment).
The current economic policies are:
Failing to achieve their stated goals.
Increasing costs for businesses and consumers.
Creating uncertainty that paralyzes investment.
Increasing the risk of a stagflationary environment.
The market has been resilient, but fundamentals are starting to crack.
What I'm Watching:
Next CPI and PCE prints for inflation persistence.
Next month's NFP for confirmation of the trend.
Fed rhetoric: If they would acknowledge the growth scare
Will Fed rate cut expectations continue to fuel US equity gains?
US August job growth missed expectations, highlighting labor market weakness, while rising Fed rate cut odds kept equities higher. Broadcom (AVGO) delivered strong 3Q earnings with robust AI-driven growth and issued an upbeat 4Q revenue forecast. Despite valuation concerns, Morgan Stanley (MS) expects multiple Fed cuts to sustain equity gains and views September dips as buying opportunities.
US500 extended its uptrend, briefly setting a new high. The index remains within the ascending channel and above both EMAs, signaling the potential extension of bullish momentum. If US500 holds above EMA21, the index may breach the 6530 high. Conversely, if US500 breaks below EMA21 and the channel’s lower bound, the index could retreat toward the support at 6340.

SPX - Is it topping or setting up a for another run up?I hang up my trader title this week as I have been whooped by poor decision making in a choppy market. But here are my scenarios I will watch as we go. I can't help to think we are topping, but also see we are still in a strong bull market; it just has been harder to swing trade the daily.
Scenarios I’m Watching
Upside Continuation:
Buyers hold above the shaded zone (6,440–6,481) and press higher along the uptrend. A clean push above 6,532 would open the door to new highs, with the trend remaining intact as long as higher lows continue.
Sideways Chop:
Price keeps oscillating above and below the 6,440–6,481 range. This would extend consolidation and could frustrate swing traders, but it would also allow moving averages to tighten then smooth out and set the stage for another leg higher.
Deeper Pullback:
If the shaded zone and uptrend line break, the next levels to watch are the 20 EMA (~6,430) and the 50 SMA (~6,355). A dip into this area could still be a normal pullback within an uptrend, especially if buyers step in quickly as they’ve done in recent weeks.
Bearish Roll-Over:
If neither the 20 EMA nor the 50 SMA hold, a breakdown toward ~6,200 is possible. While not a technical correction percentage-wise, it would feel significant for anyone who entered near recent highs.

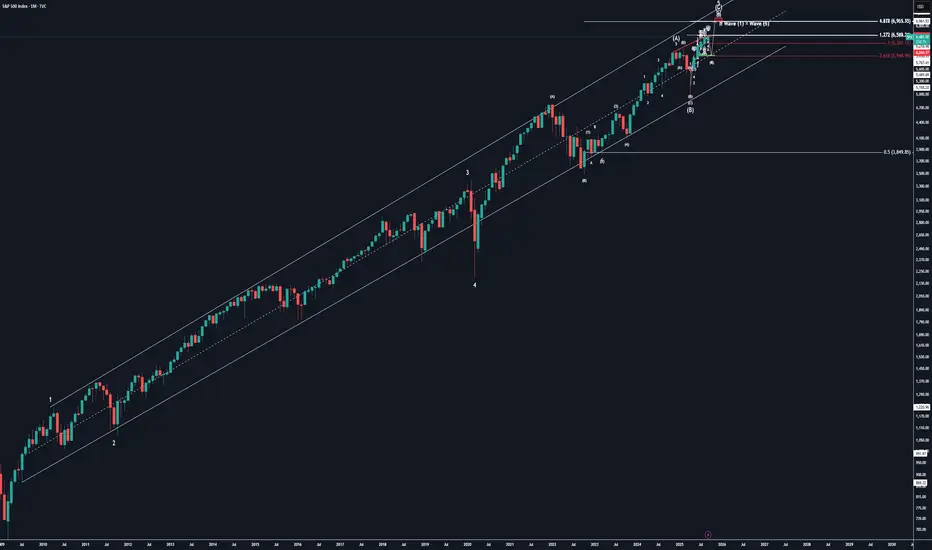
SPX 1M Since 2009 SimplifiedWe are currently in wave 5 of this supercycle which we anticipate completion of @ $6,960-$6,965
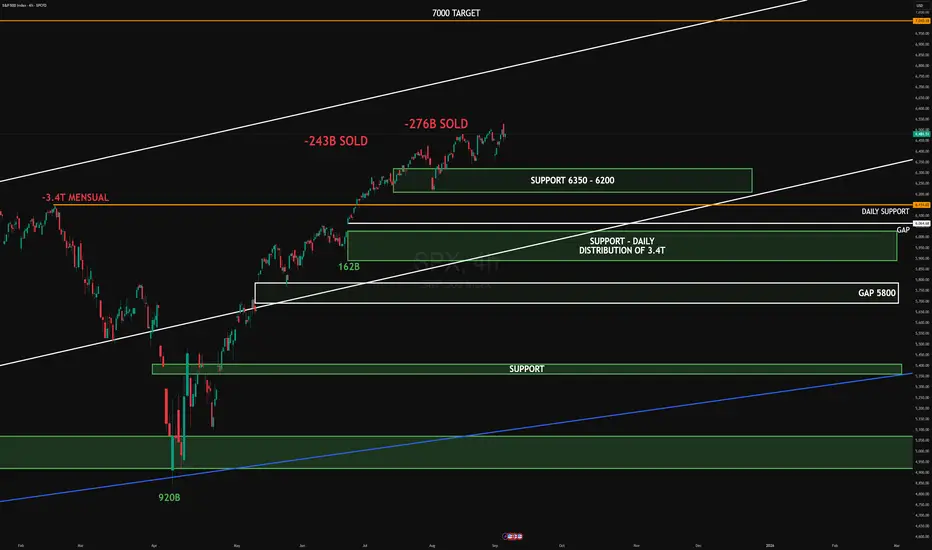
SPX DISTRIBUTION 2025SPX on the 4H chart is facing rejection near recent highs after notable sell volume (-243B and -276B).
Institutional absorption is visible, but upside momentum remains intact as long as the 6350–6200 support holds. Below that, the 3.4T daily distribution zone and the 5800 gap are key downside targets.
On the upside, the projected path points toward the 7000 area.
target: 7000
target: 5800
#SPX #globaltrade #investment #investing #stockmarket #wealth #realestate #markets #economy #finance #money #forex #trading #price #business #currency #blockchain #crypto #cryptocurrency #airdrop #btc #ethereum #ico #altcoin #cryptonews #Bitcoin #ipo
SPX into the coming weekA bit tricky because you dont know if the bears are going to get the strength.The chart has the message.No explanation needed.trendlines are derived from point and figure method.I have adapted them for bars/line charts.Your char might look different

SPX500USD is still going up slowlyHi traders,
Last week SPX500USD finished the correction (Flat) and went up again just as I've said in previous outlook.
Price is not very impulsive. It looks like it forms an ending diagonal.
So next week we could see this pair slowly going up some more.
Let's see what the market does and react.
Trade idea: Wait for a small pullback and a change in orderflow to bullish on a lower timeframe to trade longs.
If you want to learn more about trading FVG's & liquidity sweeps with Wave analysis, then please make sure to follow me.
This shared post is only my point of view on what could be the next move in this pair based on my technical analysis.
Don't be emotional, just trade your plan!
Eduwave

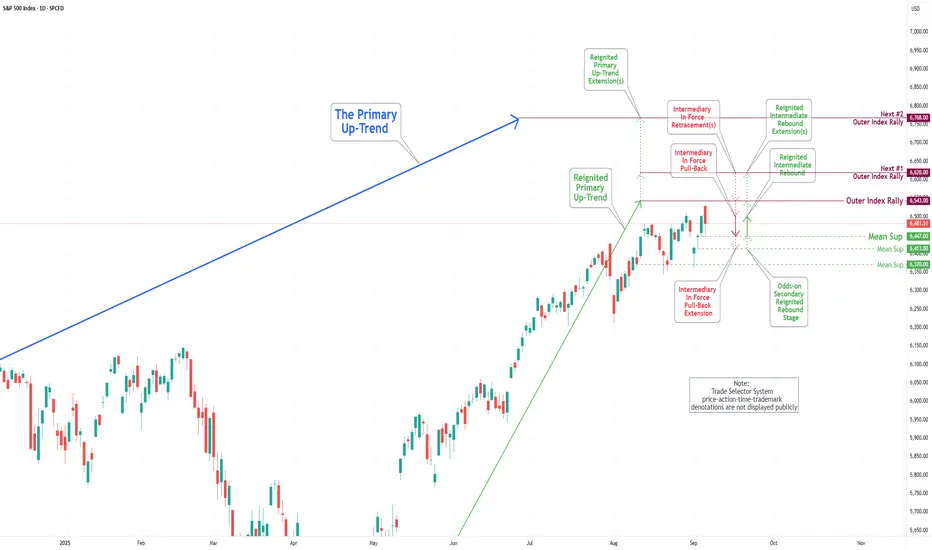
S&P 500 Daily Chart Analysis For Week of Sep 5, 2025Technical Analysis and Outlook:
During the trading sessions of the previous week, the S&P 500 Index exhibited a notable downward movement, reaching the Intermediary In Force Pullback Extension of 6370. An Odds-on Secondary Rebound subsequently followed this decline, as the index restored its upward trajectory by achieving the Mean Resistance level of 6502, although it subsequently settled below this benchmark.
It is essential to acknowledge that the current rebound from the Mean Support level of 6447 suggests a significant probability of a sustained upward movement toward the long-term objective, namely the Outer Index Rally at 6543, as detailed in the prior S&P 500 Daily Chart Analysis. Conversely, one must consider the potential for a substantial pullback to the Mean Support extension level of 6413, which would likely precede another rebound.
Moreover, it is critical to recognize that the ongoing price fluctuations may induce a considerable pullback after the fulfillment of the Outer Index Rally target at 6543. Following this anticipated downward adjustment, the index will likely resume its upward trend, targeting the completion of the Outer Index Rally at 6420.
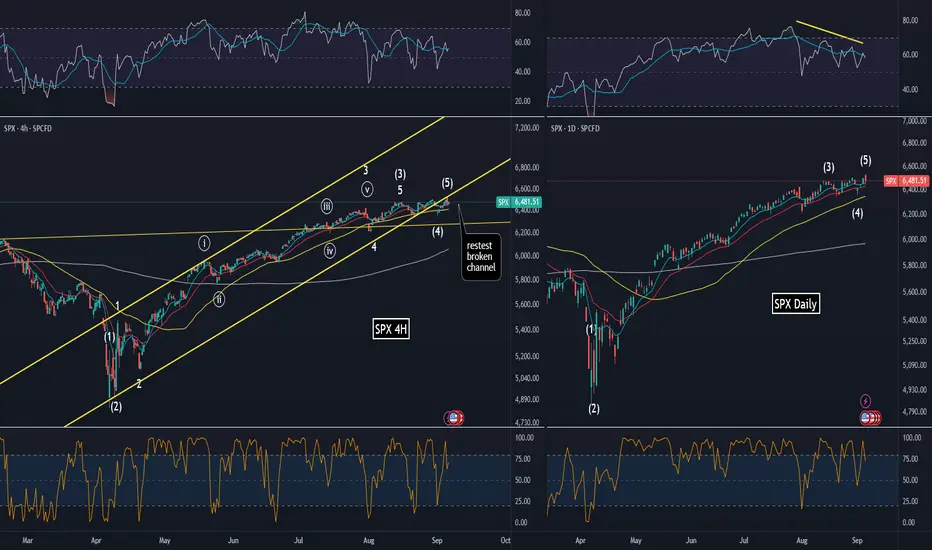
SPX topped on Sept 5I believe the Sept 5 Friday gap up and reversal at opening marked the top of the rally since Apr lows.
1. RSI div on Daily
2. Extreme chop and fading momentum since August which is typical for wave 4
3. Broken Apr trend channel and retested
4. Divergence between SPX and NDQ (which didn't make an ATH)
5. Risk-on assets like NASDAQ:SMH (e.g. NASDAQ:NVDA ), AMEX:XLK (e.g. NASDAQ:MSFT ), and BITSTAMP:BTCUSD are all breaking down
Even though there is more upside, it would be limited and we are in the late stage rally since April. Sept seasonality is real.
Weekly insighta EUR/USD S&P500 NVDA METAThis video is a weekly insights report from a financial trader on TradingView. I amdiscussing my analysis and predictions for several financial instruments based on technical and fundamental indicators.
Key Points:
Market Overview: The speaker talks about the impact of recent US unemployment data on the market, which led to a "parabolic" rise in the Euro dollar.
Euro Dollar: Based on a technical analysis of an "expanding diagonal" and an old trend line, the speaker believes a false breakout is likely. They plan to avoid trading USD pairs for the next 11 days, waiting for the Fed's interest rate decision.
S&P 500: The speaker notes a five-wave Elliot wave pattern with an expanding diagonal. They are waiting for the price to break below a trend line and a red confirmation line before considering a short position. They anticipate a "choppy" market for the coming week.
Nvidia: The speaker received "hate comments" for their previous analysis of Nvidia. They stand by their short position, citing a break below the exponential moving average, a "huge" divergence on the monthly chart, and a "shooting star" candle pattern. They note that Nvidia is the heaviest stock in the S&P 500, representing 7.5% of the index.
Bitcoin: The speaker points out that Bitcoin's price has crossed and retested two moving averages, which they see as a bearish sign. They will consider a short position if the price breaks below the previous low. They also expect Bitcoin to be stagnant in the coming week while the market waits for the Fed's decision.
Call to Action : The video concludes with a plea for viewers to subscribe to the speaker's TradingView channel for more trading insights and short-trade opportunities.

S&P 500 At Critical Juncture - 6,500 Breakout or Major RejectionUS500 Technical Analysis: 🎯 At Critical Juncture - 6,500 Breakout or Major Rejection? ⚖️
Asset: US500 (S&P 500 CFD)
Analysis Date: September 5, 2025
Current Closing Price: 6,480.0 (as of 12:59 AM UTC+4)
Timeframes Analyzed: 1H, 4H, D, W
Executive Summary & Market Outlook 🧐
The US500 is knocking on the door of a historic milestone, trading within striking distance of the 6,500 level. 🚪 This represents a massive psychological and technical barrier. The index is in a strong bullish trend but is displaying classic signs of short-term exhaustion and overextension. The price action here is critical: a decisive breakout could unleash a new wave of buying towards 6,600+, while a rejection could trigger the most significant pullback in weeks. This analysis provides a clear roadmap for intraday traders 🎯 and swing traders 📈 navigating this pivotal moment.
Multi-Timeframe Technical Analysis 🔍
1. Trend Analysis (Daily & 4-Hour Chart):
Primary Trend: 🟢 Bullish. Price is well above all major Daily Moving Averages, which are sloping upwards in bullish alignment.
Short-Term Trend: 🟡 Bullish but Fragile. The rally has been relentless, leaving the price extended and vulnerable to a sharp, news-driven correction.
2. Key Chart Patterns & Theories:
Ascending Wedge / Bull Flag? 🤔: The recent consolidation near the highs could be interpreted as a small bull flag (pausing before breakout) or the end of an ascending wedge (bearish reversal). The next major candle will likely resolve this.
Elliott Wave Theory 🌊: The rally from the last major low is a clear five-wave impulse. We are likely in the final stages of Wave 5. This suggests the completion of a cycle and warns that a larger corrective phase (Wave 4 or A-B-C) is the next probable move. A typical retracement target is the 38.2% Fibonacci level of the entire Wave 3 move.
Ichimoku Cloud (H4/D1) ☁️: Price is trading far above the Cloud on daily charts, confirming the strong bullish trend. However, this also signals a significant over-extension from mean support, increasing mean reversion risk.
Gann Theory ⏳: The 6,500 level is a key psychological and mathematical resistance. A decisive break and close above it could open the path to the next Gann angle target.
3. Critical Support & Resistance Levels:
Resistance (R1): 6,500 - 6,520 (Key Psychological & Technical Ceiling) 🚨
Resistance (R2): 6,600 (Projected Target)
Current Closing Price: ~6,480
Support (S1): 6,400 - 6,420 (Immediate Support & Prior Breakout Zone) ✅
Support (S2) : 6,300 - 6,320 (Major Support - 38.2% Fib & 21-day EMA) 🛡️
Support (S3): 6,200 (50-day EMA & 50% Fib Retracement)
4. Indicator Consensus:
RSI (14-period on 4H/D): Reading is between 68 and 72, signaling overbought conditions. 📛 This warns of weakening momentum and increased downside vulnerability. A bearish divergence on the 4H chart would be a strong short-term sell signal.
Bollinger Bands (4H) 📏: Price is hugging the upper band, a sign of strong momentum. A move back to the middle band (~6,400) would be a healthy and expected development.
Moving Averages: The bullish alignment (EMA8 > EMA21 > EMA50) is perfect. The EMA 21 on the 4H chart acts as dynamic support and is a key level for the bullish thesis.
Volume & VWAP : Volume has been inconsistent on the most recent push higher, a potential bearish divergence 📉 suggesting a lack of strong conviction from large players at these exact levels.
Trading Strategy & Forecast 🎯
A. Intraday Trading Strategy (5M - 1H Charts):
Bearish Scenario (Rejection Play) ⬇️: Given overbought conditions, this is a high-probability setup. Watch for bearish reversal candlestick patterns (e.g., Bearish Engulfing, Evening Star 🌟, Doji) at or near the 6,500 resistance.
Entry: On confirmation of rejection (e.g., a break below a 1H support low).
Stop Loss : Tight, above 6,520.
Target: 6,420 (TP1), 6,400 (TP2).
Bullish Scenario (Breakout Play) ⬆️: If buyers break through with force, wait for a pullback to the breakout level for a better entry.
Entry: On a re-test of 6,500 as new support.
Stop Loss: Below 6,480.
Target: 6,550 (TP1), 6,600 (TP2).
B. Swing Trading Strategy (4H - D Charts):
Strategy: PATIENCE IS KEY. The risk/reward for new long entries at this resistance is poor. 🚫
Ideal Long Zones: A pullback to 6,320 would be an optimal entry to add long positions for the next leg up in the primary bull trend. A shallower pullback to 6,400 could also offer an opportunity. ✅
Bearish Risk: A daily close below 6,300 would signal a deeper correction is underway, potentially targeting the 6,200 support zone.
Risk Management & Conclusion ⚠️
Key Risk Events: High-impact US data (CPI, PPI, NFP) and Fed commentary are paramount. 🔥 The market is highly sensitive to any hint of a shift in monetary policy.
Geopolitical events can also trigger flight-to-safety flows.
Position Sizing: Due to the potential for explosive volatility at this key level, conservative position sizing is non-negotiable. Risk no more than 1% of capital per trade.
Conclusion: The US500 is at a critical inflection point. ⚖️ The bullish trend is intact, but price is exhausted. This is a low-risk-taking zone. Swing traders should be patient for a better entry. Intraday traders can play the range between 6,400 and 6,500 until a decisive break occurs. The most probable outcome is a pullback to recharge before the next major directional move. 📊
Overall Bias: 🟢 Bullish above 6,320 | 🟡 Neutral/Bearish between 6,480-6,500
Sp500 4H Trading Outlook for the Upcoming Week
In this series of analyses, we review trading perspectives and short-term outlooks.
As can be seen, in each analysis there is a key support/resistance zone near the current price of the asset. The market’s reaction to—or breakout from—this zone will determine the next price movement toward the specified levels.
Important Note: The purpose of these trading outlooks is to highlight key levels ahead of the price and the market’s potential reactions to them. The analyses provided are by no means trading signals!
SPX at verge of breaking down?SP:SPX is treading dangerously in a bearish wedge formation with multiple bearish divergences in RSI.
A breakdown from here could send it around 6200 zone. And that might just be beginning of the fall everyone is waiting for, on account of excessive debt and inflation situation.

Signals Align for an S&P 500 PullbackThe VANTAGE:SP500 has broken below the EMA 200/100/50/20 while forming a bearish rising wedge and completing an Elliott 5-wave sequence. A MACD bearish crossover and an RSI near 40 further confirm downside momentum. However, this sets the stage for attractive buying opportunities in the near term.
