SPX to Money Supply WARNING!If the charts aren’t showing bubble setups, I’m not going to invent them. I post what the data shows. So please don’t shoot the messenger when I say GTFO & STFO.
And just to keep the facts straight:
Brokerage, stock, and crypto accounts are not part of M2.
Why does M2 matter?
It’s the actual spe
S&P 500 Index
No trades
About S&P 500 Index
Standard and Poor's 500 Index is a capitalization-weighted stock market index measuring the performance of 500 large publicly traded companies in the United States. This index covers a wide range of industries, including technology, healthcare, energy, and finance. It serves as a benchmark for the overall health of the U.S. stock market, as well as a reflection of the country's economic strength.
Substantial gains in the S&P 500 are often interpreted as positive signals for the economy, while losses can be seen as indicators of potential trouble. Investors use this index as a barometer for their own portfolios and to assess the performance of individual stocks. The S&P 500 index plays a vital role in the financial world and is closely watched by analysts and policymakers.
Substantial gains in the S&P 500 are often interpreted as positive signals for the economy, while losses can be seen as indicators of potential trouble. Investors use this index as a barometer for their own portfolios and to assess the performance of individual stocks. The S&P 500 index plays a vital role in the financial world and is closely watched by analysts and policymakers.
Related indices

S&P500 Points Toward 7,500—But the Path Won’t Be a Straight LineS&P500 remains structurally bullish on the higher timeframes, and the broader geometry continues to point toward the 7,500 area as a long-term magnet.
However, the market never moves in a straight line — corrective phases, pullbacks, and rotations are a natural part of the path toward higher levels.

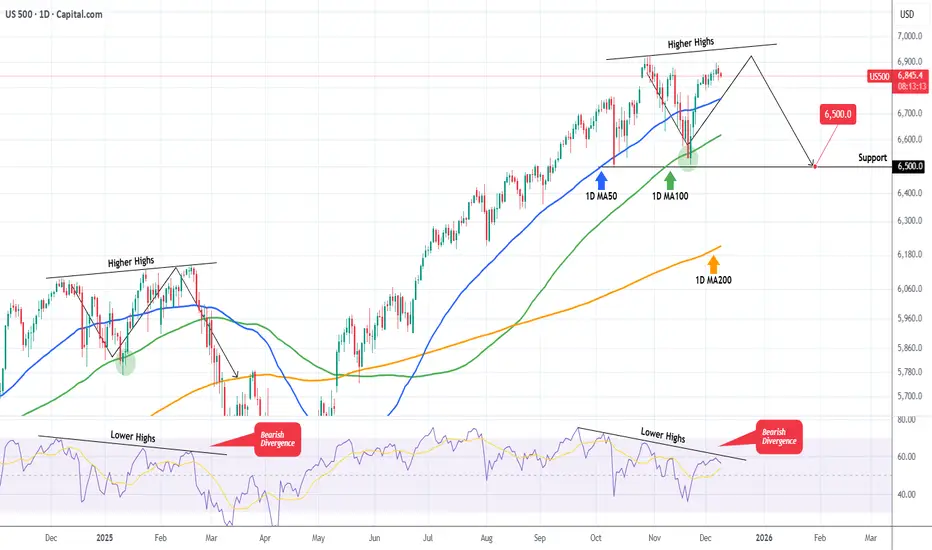
S&P500 The Bearish Divergence that may spoil the party.S&P500 (SPX) is extending a strong rally following the rebound on its 1D MA100 (green trend-line) almost 3 weeks ago. As we pointed out in a previous analysis, the price action of the past 2 months has been identical to the pattern after November 19 2024.
We are currently on the same 1D MA100 rebou
S&P 500 4H: Trendline SHATTERED! Bullish Revival or Bear Trap? Following the formation of a Higher High (HH) ↗️, the market entered a correction and later established a Higher Low (HL) ↗️, confirming the continuation of the bullish structure on the 4-hour timeframe.
Subsequently, price entered a consolidation phase below a descending trendline, and early signs

FRIDAY SELL SIDE LIQUIDITY CLEARANCE!Sell side liquidity has been building since the beginning of this week, Monday, 1st December. My expectation is that the market shall end the week, firstly by moving higher, a Judas Swing, to sweep buy side liquidity at the Daily Level. Then reverse sharply and descend to take out the entire week's

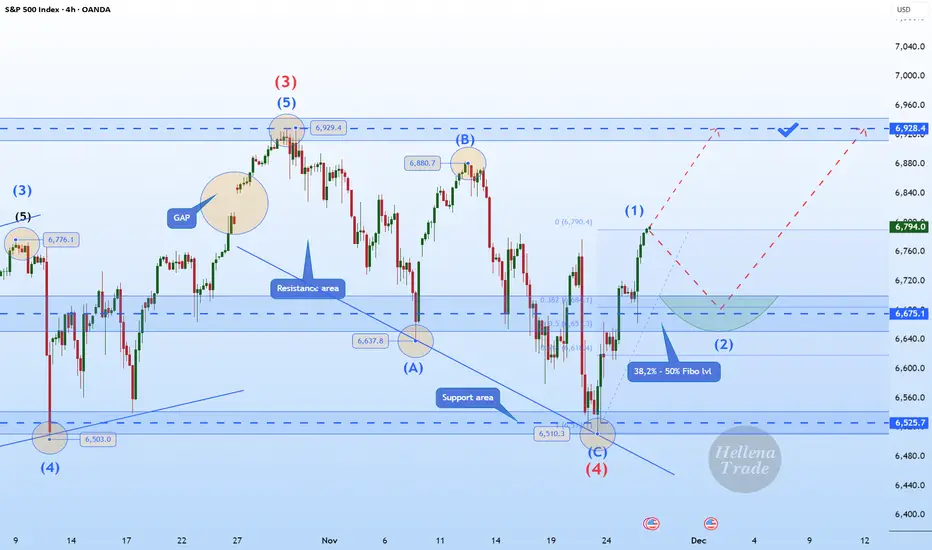
Hellena | SPX500 (4H): LONG to MAX of wave "3" of 6928.Colleagues, we continue the previous scenario of upward movement in the impulse “12345”.
I expect a small correction in the middle order wave “2” approximately to the area of 38.2%-50% Fibonacci levels (6675).
Then I expect a continuation of the upward movement to the maximum of the wave "3" of the
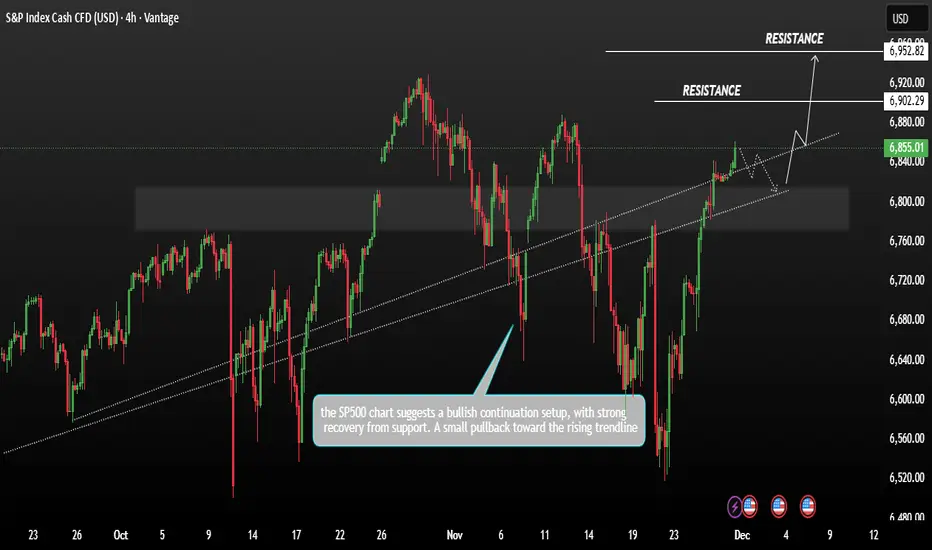
SP500 Consolidation bullish momentumSP500 showing price action between late September and early December the SP is trading around 6,855 after a strong upward move recent candles show bullish momentum pushing above a previously broken trendline.
The S&P 500 rose on Friday, pushing it close to its record high. A strong November rally,
Moving dayThe market made a high in futures at about 9am, so to confirm it in cash would be most probable. Either way I think this market is about to drop. Gold can go higher still to test it's highs. Oil looks bearish still. BTC may be done correcting. Natural Gas looks like a short still.

S&P vs CryptoThe S&P is completing its cycle, and after that it is expected to correct to the specified levels, followed by a correction in Bitcoin as well.
btc
BAT is correcting toward the specified levels after completing its flag pattern
Most other coins are also mimicking Bitcoin’s behavior
link

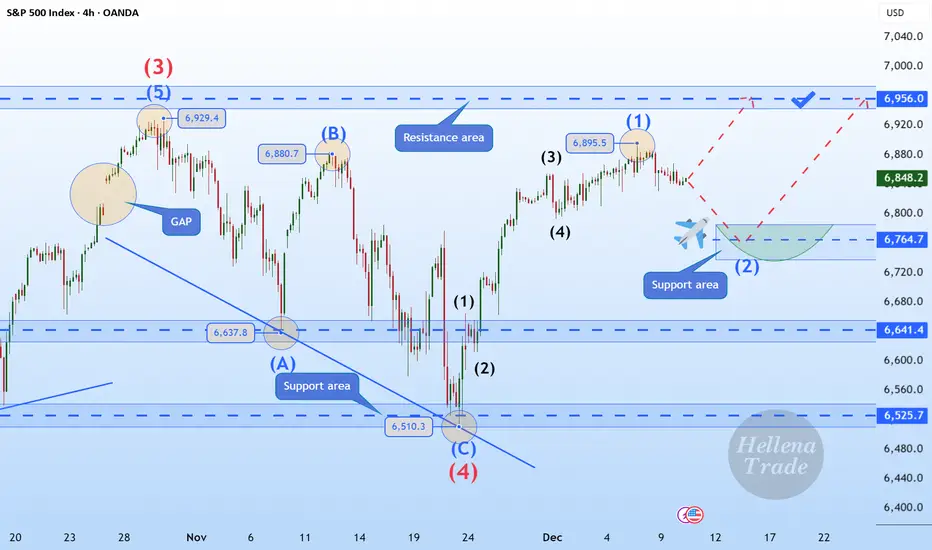
Hellena | SPX500 (4H): LONG to the area of 6956.Hello, colleagues!
I previously published a forecast for an upward movement, and I believe it is time to update the plan slightly. The direction of movement remains the same, but wave “1” has lengthened, which means that the correction in wave “2” may occur slightly higher than previously.
I expec
See all ideas
Summarizing what the indicators are suggesting.
Oscillators
Neutral
SellBuy
Strong sellStrong buy
Strong sellSellNeutralBuyStrong buy
Oscillators
Neutral
SellBuy
Strong sellStrong buy
Strong sellSellNeutralBuyStrong buy
Summary
Neutral
SellBuy
Strong sellStrong buy
Strong sellSellNeutralBuyStrong buy
Summary
Neutral
SellBuy
Strong sellStrong buy
Strong sellSellNeutralBuyStrong buy
Summary
Neutral
SellBuy
Strong sellStrong buy
Strong sellSellNeutralBuyStrong buy
Moving Averages
Neutral
SellBuy
Strong sellStrong buy
Strong sellSellNeutralBuyStrong buy
Moving Averages
Neutral
SellBuy
Strong sellStrong buy
Strong sellSellNeutralBuyStrong buy
Displays a symbol's price movements over previous years to identify recurring trends.
Frequently Asked Questions
The current value of S&P 500 Index is 6,842.11 USD — it has fallen by −0.09% in the past 24 hours. Track the index more closely on the S&P 500 Index chart.
S&P 500 Index reached its highest quote on Oct 29, 2025 — 6,920.34 USD. See more data on the S&P 500 Index chart.
The lowest ever quote of S&P 500 Index is 2.73 USD. It was reached on Jun 1, 1877. See more data on the S&P 500 Index chart.
S&P 500 Index value has increased by 0.14% in the past week, since last month it has shown a 2.16% increase, and over the year it's increased by 12.95%. Keep track of all changes on the S&P 500 Index chart.
The top companies of S&P 500 Index are NASDAQ:NVDA, NASDAQ:AAPL, and NASDAQ:GOOGL — they can boast market cap of 4.49 T USD, 4.10 T USD, and 3.83 T USD accordingly.
The highest-priced instruments on S&P 500 Index are NYSE:NVR, NASDAQ:BKNG, and NYSE:AZO — they'll cost you 7,318.29 USD, 5,195.76 USD, and 3,496.77 USD accordingly.
The champion of S&P 500 Index is NASDAQ:SNDK — it's gained 525.96% over the year.
The weakest component of S&P 500 Index is NASDAQ:TTD — it's lost −71.16% over the year.
S&P 500 Index is just a number that lets you track performance of the instruments comprising the index, so you can't invest in it directly. But you can buy S&P 500 Index futures or funds or invest in its components.
The S&P 500 Index is comprised of 503 instruments including NASDAQ:NVDA, NASDAQ:AAPL, NASDAQ:GOOGL and others. See the full list of S&P 500 Index components to find more opportunities.