SPX to Money Supply WARNING!If the charts aren’t showing bubble setups, I’m not going to invent them. I post what the data shows. So please don’t shoot the messenger when I say GTFO & STFO.
And just to keep the facts straight:
Brokerage, stock, and crypto accounts are not part of M2.
Why does M2 matter?
It’s the actual spe
About S&P 500 Index
Standard and Poor's 500 Index is a capitalization-weighted stock market index measuring the performance of 500 large publicly traded companies in the United States. This index covers a wide range of industries, including technology, healthcare, energy, and finance. It serves as a benchmark for the overall health of the U.S. stock market, as well as a reflection of the country's economic strength.
Substantial gains in the S&P 500 are often interpreted as positive signals for the economy, while losses can be seen as indicators of potential trouble. Investors use this index as a barometer for their own portfolios and to assess the performance of individual stocks. The S&P 500 index plays a vital role in the financial world and is closely watched by analysts and policymakers.
Substantial gains in the S&P 500 are often interpreted as positive signals for the economy, while losses can be seen as indicators of potential trouble. Investors use this index as a barometer for their own portfolios and to assess the performance of individual stocks. The S&P 500 index plays a vital role in the financial world and is closely watched by analysts and policymakers.
Related indices

S&P 500 4H: Trendline SHATTERED! Bullish Revival or Bear Trap? Following the formation of a Higher High (HH) ↗️, the market entered a correction and later established a Higher Low (HL) ↗️, confirming the continuation of the bullish structure on the 4-hour timeframe.
Subsequently, price entered a consolidation phase below a descending trendline, and early signs

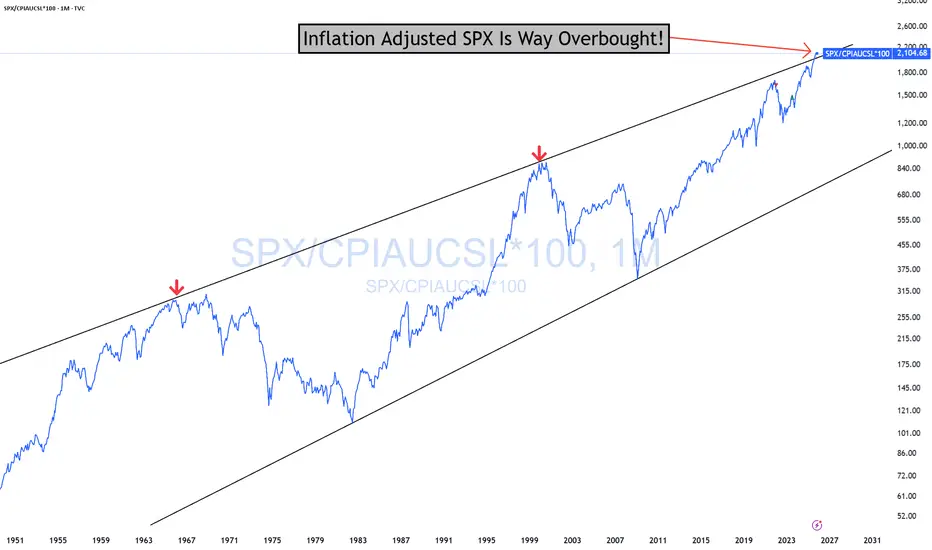
SPX Overbought In Real Terms WARNING!SPX Overbought In Real Terms (Inflation-adjusted) Stripping away inflation shows you the "real" value of SPX.
This is not something you will likely see again in your lifetime. We have only been this overbought twice before since 1947! Both times, what followed was a bear market. You are far more l
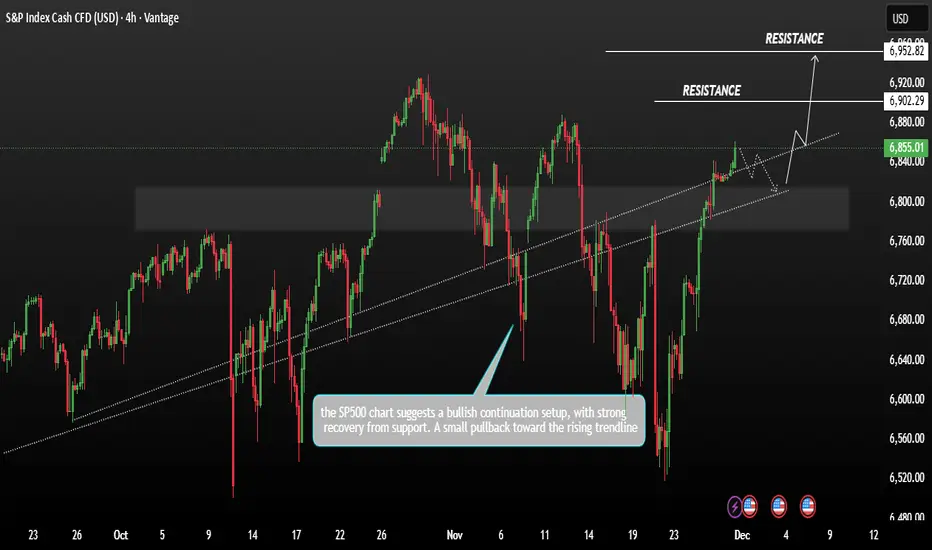
SP500 Consolidation bullish momentumSP500 showing price action between late September and early December the SP is trading around 6,855 after a strong upward move recent candles show bullish momentum pushing above a previously broken trendline.
The S&P 500 rose on Friday, pushing it close to its record high. A strong November rally,
SP500 Bullish Divergence Detected (SPY)Bullish divergence of the SP500 and NYSE Advance Decline Line (ADL) is one of the most powerful and reliable "leading" indicators available. Here we see the ADL make a new high (a higher high) while the SP500 does not make a new high. This divergence indicates that market breadth is markly improving

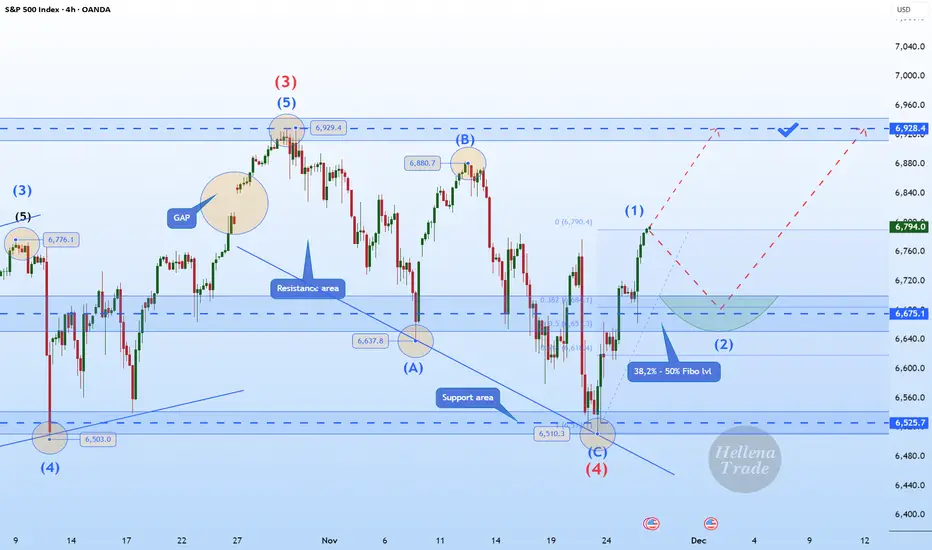
Hellena | SPX500 (4H): LONG to MAX of wave "3" of 6928.Colleagues, we continue the previous scenario of upward movement in the impulse “12345”.
I expect a small correction in the middle order wave “2” approximately to the area of 38.2%-50% Fibonacci levels (6675).
Then I expect a continuation of the upward movement to the maximum of the wave "3" of the
SPX500: Bullish Push to 6927?As the previous analysis worked exactly as predicted, FX:SPX500 is eyeing a bullish breakout on the 4-hour chart , with price rebounding from a key support zone near recent lows , converging with potential entry area that could ignite upside momentum if buyers defend against dips. This setup su

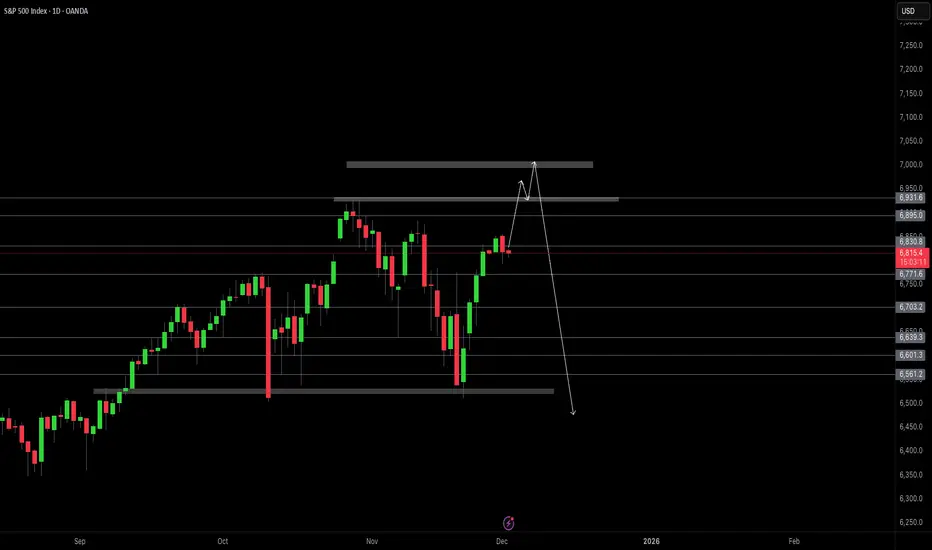
Moving dayThe market made a high in futures at about 9am, so to confirm it in cash would be most probable. Either way I think this market is about to drop. Gold can go higher still to test it's highs. Oil looks bearish still. BTC may be done correcting. Natural Gas looks like a short still.

S&P500 Idea FOMCBias until Dec FOMC:
We will be looking to continue to ride the Fed rate cuts odds increased on the markets as that is still holding most weight at the moment and will most likely continue to do so until the FOMC decision on 11 December.
The markets have been primarily pricing in the rate cut expe
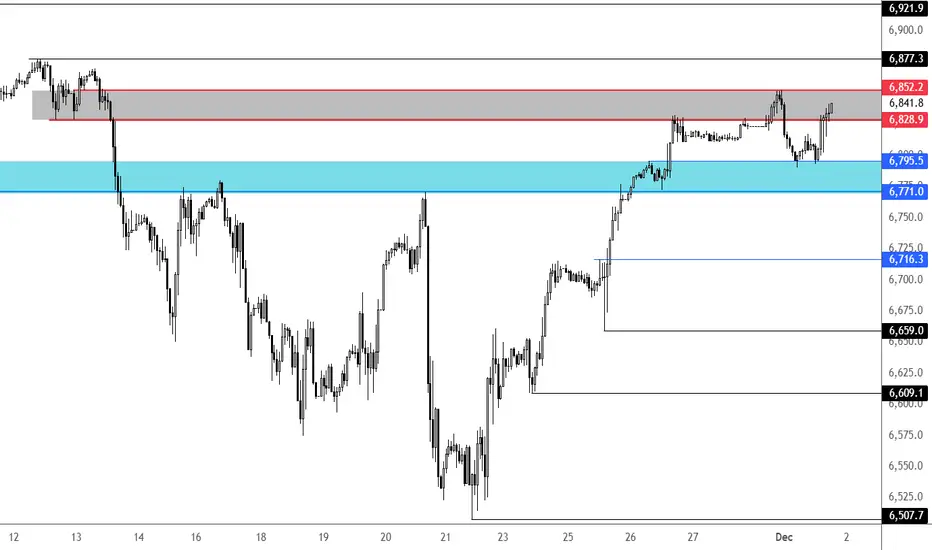
S&P 500 key levels to watchUS indices have managed to bounce nicely off their overnight lows, despite concerns about the yen-funded carry trade unwind and crypto selling. The S&P has now entered a key inflection point again, near 6840-52 area; let's see whether the bulls will be able to reclaim this zone and kick on from ther
See all ideas
Summarizing what the indicators are suggesting.
Oscillators
Neutral
SellBuy
Strong sellStrong buy
Strong sellSellNeutralBuyStrong buy
Oscillators
Neutral
SellBuy
Strong sellStrong buy
Strong sellSellNeutralBuyStrong buy
Summary
Neutral
SellBuy
Strong sellStrong buy
Strong sellSellNeutralBuyStrong buy
Summary
Neutral
SellBuy
Strong sellStrong buy
Strong sellSellNeutralBuyStrong buy
Summary
Neutral
SellBuy
Strong sellStrong buy
Strong sellSellNeutralBuyStrong buy
Moving Averages
Neutral
SellBuy
Strong sellStrong buy
Strong sellSellNeutralBuyStrong buy
Moving Averages
Neutral
SellBuy
Strong sellStrong buy
Strong sellSellNeutralBuyStrong buy
Displays a symbol's price movements over previous years to identify recurring trends.
Frequently Asked Questions
The current value of S&P 500 Index is 6,857.13 USD — it has risen by 0.30% in the past 24 hours. Track the index more closely on the S&P 500 Index chart.
S&P 500 Index reached its highest quote on Oct 29, 2025 — 6,920.34 USD. See more data on the S&P 500 Index chart.
The lowest ever quote of S&P 500 Index is 2.73 USD. It was reached on Jun 1, 1877. See more data on the S&P 500 Index chart.
S&P 500 Index value has increased by 0.83% in the past week, since last month it has shown a −0.47% decrease, and over the year it's increased by 12.98%. Keep track of all changes on the S&P 500 Index chart.
The top companies of S&P 500 Index are NASDAQ:NVDA, NASDAQ:AAPL, and NASDAQ:GOOGL — they can boast market cap of 4.46 T USD, 4.15 T USD, and 3.84 T USD accordingly.
The highest-priced instruments on S&P 500 Index are NYSE:NVR, NASDAQ:BKNG, and NYSE:AZO — they'll cost you 7,519.67 USD, 5,027.20 USD, and 3,840.50 USD accordingly.
The champion of S&P 500 Index is NASDAQ:SNDK — it's gained 508.41% over the year.
The weakest component of S&P 500 Index is NASDAQ:TTD — it's lost −72.00% over the year.
S&P 500 Index is just a number that lets you track performance of the instruments comprising the index, so you can't invest in it directly. But you can buy S&P 500 Index futures or funds or invest in its components.
The S&P 500 Index is comprised of 503 instruments including NASDAQ:NVDA, NASDAQ:AAPL, NASDAQ:GOOGL and others. See the full list of S&P 500 Index components to find more opportunities.